
Market Timing Results

| MDM Performance since Feb 9, 2019* (delayed for non-members) | ||
|---|---|---|
| TECL: | +66% **, *** | (as of 6 Mar 2025) |
In this Era of QE, since late 2008 when QE began, the steeper the drop, the greater the upside since tech-driven major averages such as TECL often hit new highs often within a few months of the typical 'V' bottom. Because of this, some start buying the further major indices fall then, as they make new highs, profits are slowly taken. It's an entirely different dynamic but suits some investors' risk tolerance preferences. Some use the MDM in this manner so if its losses exceed a certain amount during a buy signal, they first sell their position then start to slowly buy if the market continues to fall even if the model stays on a cash signal. Likewise, they may start to take partial profits as the market continues to make new highs on a buy signal. Since markets inevitably make major lows or highs, this is a way to increase profits overall. Further, when the rate of global liquidity (money printing across central banks) is accelerating, the model is far more likely to go from buy to cash (instead of sell) back to buy as it did through most of 2020 and 2021.
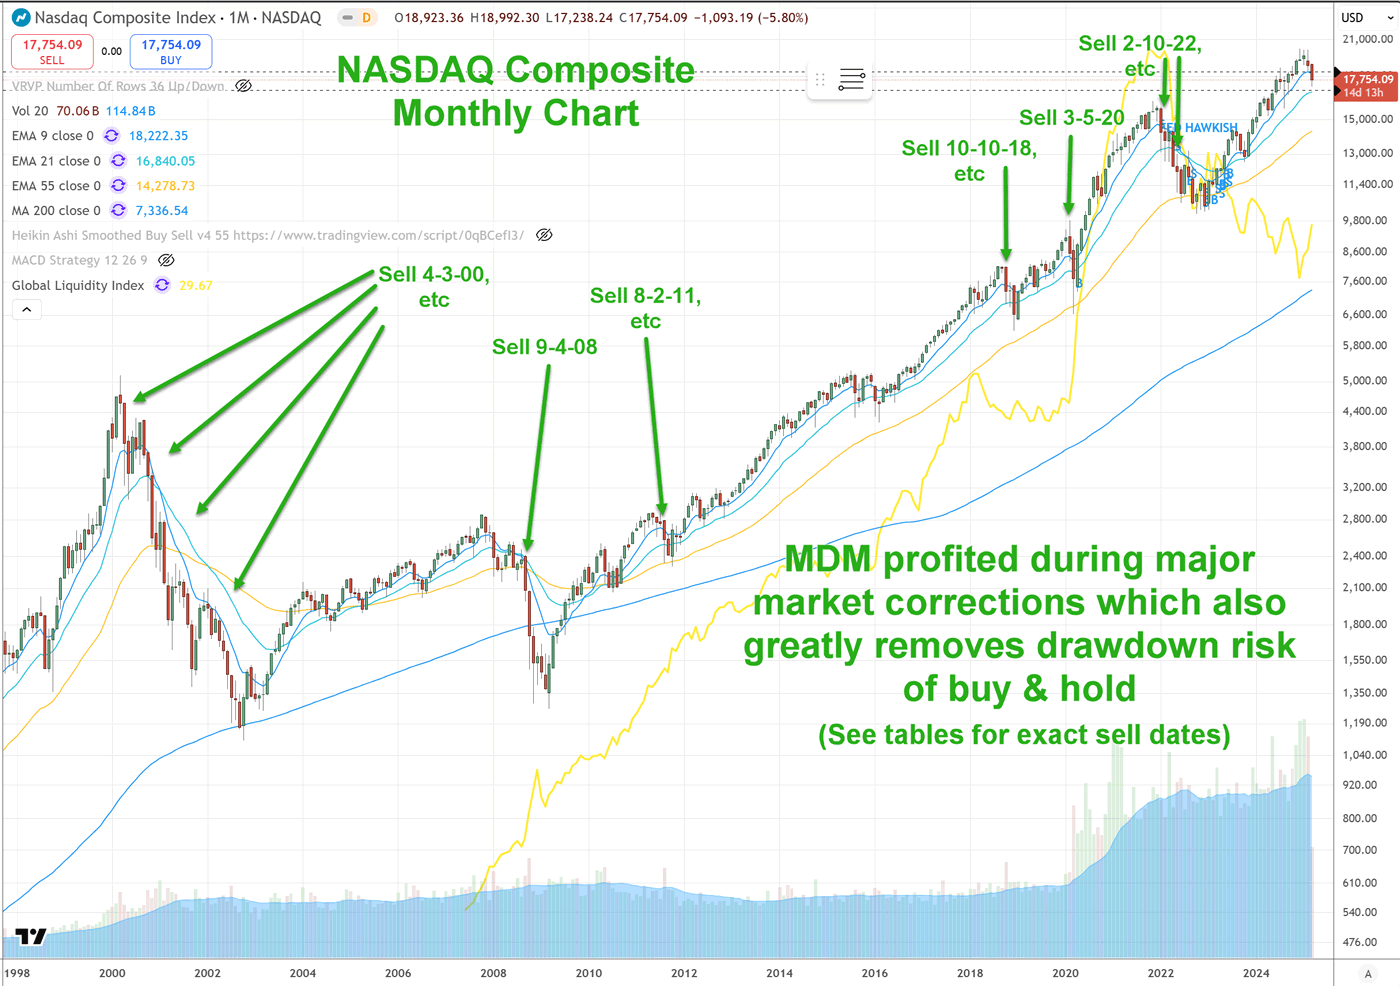
| NASDAQ Composite Market Direction Model Trading Return Jan 31, 2000 - Sep 25, 2023 |
+1,720%* |
|---|---|
| NASDAQ Composite Buy and Hold Return Jan 31, 2000 - Sep 25, 2023 |
+236% |
| Index | Market Direction Model Trading Return Jan 31, 2000 - Sep 25, 2023 |
Buy-and-Hold Return Jan 31, 2000 - Sep 25, 2023 |
|---|---|---|
| NASDAQ Composite | +1,720%* | +236% |
Note: All data shown below are delayed by up to two months for non-members. Some signals that are showing big profits may have the time delay removed to show non-members the success of the current signal. The risk in entering such a position late is not recommended. New members should wait until either model switches signals before buying a position.
Members receive emails in real-time whenever either of the models switch signals.
- You will receive an email whenever the model switches signals.
- Choose from the list of suggested ETFs. Buy the ETF.
- Await the next change in signal.
| Date | Signal | % gain / loss | $1 becomes |
|---|---|---|---|
| 03-06-2025 | Sell | 2.18 | 5.37 |
| 03-03-2025 | Cash | 5.26 | |
| 02-14-2025 | Buy | -24.23 * | 5.26 |
| 02-07-2025 | Cash | 6.94 | |
| 01-21-2025 | Buy | -5.01 | 6.94 |
| 01-02-2025 | Cash | 7.31 | |
| 09-11-2024 | Buy | 26.69 | 7.31 |
| 09-05-2024 | Sell | -3.59 | 5.77 |
| 08-07-2024 | Buy | 0.91 | 5.98 |
| 08-06-2024 | Sell | -8.14 | 5.93 |
| 07-05-2024 | Buy | -39.02 * | 6.45 |
| 07-01-2024 | Cash | 10.57 | |
| 06-12-2024 | Buy | 3.29 | 10.57 |
| 06-10-2024 | Cash | 10.23 | |
| 05-10-2024 | Buy | 10.91 | 10.23 |
| 05-03-2024 | Cash | 9.22 | |
| 05-01-2024 | Sell | -11.67 | 9.22 |
| 04-25-2024 | Cash | 10.44 | |
| 04-22-2024 | Buy | 2.47 | 10.44 |
| 04-15-2024 | Sell | 11.93 | 10.19 |
| 04-10-2024 | Cash | 9.10 | |
| 03-20-2024 | Buy | -6.42 | 9.10 |
| 03-11-2024 | Cash | 9.73 | |
| 02-07-2024 | Buy | 2.02 | 9.73 |
| 01-31-2024 | Cash | 9.54 | |
| 01-19-2024 | Buy | 0.56 | 9.54 |
| 01-11-2024 | Cash | 9.49 | |
| 11-28-2023 | Buy | 4.94 | 9.49 |
| 11-14-2023 | Cash | 9.04 | |
| 09-26-2023 | Sell | -37.49 * | 9.04 |
| 09-25-2023 | Cash | 14.46 | |
| 08-24-2023 | Sell | 11.35 | 14.46 |
| 08-11-2023 | Cash | 12.99 | |
| 07-12-2023 | Buy | -12.72 | 12.99 |
| 06-23-2023 | Cash | 14.88 | |
| 06-21-2023 | Buy | -1.5 | 14.88 |
| 04-05-2023 | Cash | 15.11 | |
| 04-03-2023 | Buy | -5.21 | 15.11 |
| 03-13-2023 | Cash | 15.94 | |
| 05-11-2022 | Sell | 23.38 | 15.94 |
| 05-04-2022 | Cash | 12.92 | |
| 02-10-2022 | Sell | 28.97 | 12.92 |
| 01-03-2022 | Cash | 10.02 | |
| 12-14-2021 | Sell | -6.31 | 10.02 |
| 11-30-2021 | Cash | 10.69 | |
| 11-29-2021 | Buy | -0.82 | 10.69 |
| 11-22-2021 | Cash | 10.78 | |
| 10-20-2021 | Buy | 26.64 | 10.78 |
| 09-28-2021 | Cash | 8.51 | |
| 09-22-2021 | Buy | -0.96 | 8.51 |
| 09-20-2021 | Cash | 8.59 | |
| 07-28-2021 | Buy | -4.07 | 8.59 |
| 07-15-2021 | Cash | 8.95 | |
| 07-01-2021 | Buy | 10.33 | 8.95 |
| 05-12-2021 | Cash | 8.11 | |
| 04-01-2021 | Buy | -3.81 | 8.11 |
| 03-08-2021 | Cash | 8.43 | |
| 01-07-2021 | Buy | -1.67 | 8.43 |
| 01-06-2021 | Cash | 8.57 | |
| 11-24-2020 | Buy | 15.98 | 8.57 |
| 11-02-2020 | Cash | 7.39 | |
| 06-15-2020 | Buy | 26.11 | 7.39 |
| 06-15-2020 | Cash | 5.86 | |
| 06-01-2020 | Buy | -1.36 | 5.86 |
| 04-22-2020 | Cash | 5.94 | |
| 03-05-2020 | Sell | 37.29 | 5.94 |
| 03-05-2020 | Cash | 4.33 | |
| 11-01-2019 | Buy | 18.87 | 4.33 |
| 10-01-2019 | Cash | 3.64 | |
| 09-05-2019 | Buy | -2.6 | 3.64 |
| 08-23-2019 | Cash | 3.74 | |
| 08-19-2019 | Buy | -7.68 | 3.74 |
| 08-05-2019 | Cash | 4.05 | |
| 06-13-2019 | Buy | -0.34 | 4.05 |
| 05-13-2019 | Cash | 4.06 | |
| 02-07-2019 ** | Buy | 25.54 | 4.06 |
| 01-22-2019 | Sell | -15.84 | 3.23 |
| 01-03-2019 | Cash | 3.84 | |
| 01-02-2019 | Sell | 2.05 | 3.84 |
| 12-21-2018 | Cash | 3.76 | |
| 12-21-2018 | Buy | -5.65 | 3.76 |
| 12-03-2018 | Cash | 3.98 | |
| 11-07-2018 | Buy | -9.54 | 3.98 |
| 11-02-2018 | Cash | 4.40 | |
| 10-22-2018 | Sell | 2.74 | 4.40 |
| 10-12-2018 | Cash | 4.28 | |
| 10-10-2018 | Sell | 10.7 | 4.28 |
| 10-09-2018 | Buy | -3.03 | 3.87 |
| 10-04-2018 | Sell | 8.3 | 3.99 |
| 07-18-2018 | Buy | 9.65 | 3.68 |
| 07-16-2018 | Cash | 3.36 | |
| 07-03-2018 | Sell | -9.49 | 3.36 |
| 06-25-2018 | Cash | 3.71 | |
| 06-20-2018 | Buy | -5.75 | 3.71 |
| 06-19-2018 | Cash | 3.94 | |
| 06-01-2018 | Buy | 3.06 | 3.94 |
| 05-07-2018 | Cash | 3.82 | |
| 05-01-2018 | Sell | -12.18 | 3.82 |
| 04-24-2018 | Cash | 4.35 | |
| 04-10-2018 | Buy | -6.39 | 4.35 |
| 04-03-2018 | Sell | -7.74 | 4.65 |
| 03-26-2018 | Cash | 5.04 | |
| 03-23-2018 | Sell | -3.91 | 5.04 |
| 03-19-2018 | Cash | 5.25 | |
| 03-09-2018 | Buy | -5.53 | 5.25 |
| 02-05-2018 | Cash | 5.56 | |
| 12-27-2017 | Buy | -0.98 | 5.56 |
| 11-29-2017 | Cash | 5.62 | |
| 09-08-2017 | Buy | 25.92 | 5.62 |
| 08-21-2017 | Cash | 4.46 | |
| 08-18-2017 | Buy | -3 | 4.46 |
| 08-17-2017 | Cash | 4.60 | |
| 08-16-2017 | Buy | -3.82 | 4.60 |
| 08-10-2017 | Cash | 4.78 | |
| 07-11-2017 | Buy | 9.92 | 4.78 |
| 06-29-2017 | Cash | 4.35 | |
| 06-15-2017 | Buy | -5.23 | 4.35 |
| 06-14-2017 | Cash | 4.59 | |
| 04-25-2017 | Buy | 6.81 | 4.59 |
| 04-20-2017 | Cash | 4.30 | |
| 04-18-2017 | Sell | -3.61 | 4.30 |
| 01-31-2017 | Buy | 16.68 | 4.46 |
| 01-30-2017 | Cash | 3.82 |
In this Era of QE, since late 2008 when QE began, the steeper the drop, the greater the upside since tech-driven major averages such as TECL often hit new highs often within a few months of the typical 'V' bottom. Because of this, some start buying the further major indices fall then, as they make new highs, profits are slowly taken. It's an entirely different dynamic but suits some investors' risk tolerance preferences. Some use the MDM in this manner so if its losses exceed a certain amount during a buy signal, they first sell their position then start to slowly buy if the market continues to fall even if the model stays on a cash signal. Likewise, they may start to take partial profits as the market continues to make new highs on a buy signal. Since markets inevitably make major lows or highs, this is a way to increase profits overall. Further, when the rate of global liquidity (money printing across central banks) is accelerating, the model is far more likely to go from buy to cash (instead of sell) back to buy as it did through most of 2020 and 2021.
| Date | Signal | % gain / loss | $1 becomes |
|---|---|---|---|
| 03-06-2025 | Sell | 1.7 | 43,493.34 |
| 03-03-2025 | Cash | 42,765.47 | |
| 02-14-2025 | Buy | -8.02 * | 42,765.47 |
| 02-07-2025 | Cash | 46,492.01 | |
| 01-21-2025 | Buy | -1.05 | 46,492.01 |
| 01-02-2025 | Cash | 46,987.26 | |
| 09-11-2024 | Buy | 13.24 | 46,987.26 |
| 09-05-2024 | Sell | 0.02 | 41,493.25 |
| 08-07-2024 | Buy | 2.66 | 41,485.96 |
| 08-06-2024 | Sell | -2.35 | 40,411.37 |
| 07-05-2024 | Buy | -10.9 * | 41,382.16 |
| 07-01-2024 | Cash | 46,445.05 | |
| 06-12-2024 | Buy | 1.41 | 46,445.05 |
| 06-10-2024 | Cash | 45,801.29 | |
| 05-10-2024 | Buy | 4.13 | 45,801.29 |
| 05-03-2024 | Cash | 43,983.61 | |
| 05-01-2024 | Sell | -3.18 | 43,983.61 |
| 04-25-2024 | Cash | 45,427.65 | |
| 04-22-2024 | Buy | -0.03 | 45,427.65 |
| 04-15-2024 | Sell | 3.28 | 45,442.42 |
| 04-10-2024 | Cash | 44,000.81 | |
| 03-20-2024 | Buy | -1.26 | 44,000.81 |
| 03-11-2024 | Cash | 44,560.93 | |
| 02-07-2024 | Buy | 2.18 | 44,560.93 |
| 01-31-2024 | Cash | 43,612.12 | |
| 01-19-2024 | Buy | 0.56 | 43,612.12 |
| 01-11-2024 | Cash | 43,371.03 | |
| 11-28-2023 | Buy | 3.69 | 43,371.03 |
| 11-14-2023 | Cash | 41,828.65 | |
| 09-26-2023 | Sell | -7.86 * | 41,828.65 |
| 09-25-2023 | Cash | 45,396.97 | |
| 08-24-2023 | Sell | 3.57 | 45,396.97 |
| 08-11-2023 | Cash | 43,833.20 | |
| 07-12-2023 | Buy | -2.02 | 43,833.20 |
| 06-23-2023 | Cash | 44,736.61 | |
| 06-21-2023 | Buy | -0.25 | 44,736.61 |
| 04-05-2023 | Cash | 44,849.49 | |
| 04-03-2023 | Buy | -1.56 | 44,849.49 |
| 03-13-2023 | Cash | 45,562.22 | |
| 05-11-2022 | Sell | 3.78 | 45,562.22 |
| 05-04-2022 | Cash | 43,903.01 | |
| 02-10-2022 | Sell | 9.69 | 43,903.01 |
| 01-03-2022 | Cash | 40,024.09 | |
| 12-14-2021 | Sell | -3.12 | 40,024.09 |
| 11-30-2021 | Cash | 41,314.49 | |
| 11-29-2021 | Buy | -1.4 | 41,314.49 |
| 11-22-2021 | Cash | 41,900.93 | |
| 10-20-2021 | Buy | 5.87 | 41,900.93 |
| 09-28-2021 | Cash | 39,578.04 | |
| 09-22-2021 | Buy | -0.25 | 39,578.04 |
| 09-20-2021 | Cash | 39,677.09 | |
| 07-28-2021 | Buy | -0.54 | 39,677.09 |
| 07-15-2021 | Cash | 39,891.25 | |
| 07-01-2021 | Buy | 0.73 | 39,891.25 |
| 05-12-2021 | Cash | 39,603.49 | |
| 04-01-2021 | Buy | -1.48 | 39,603.49 |
| 03-08-2021 | Cash | 40,197.72 | |
| 01-07-2021 | Buy | -0.05 | 40,197.72 |
| 01-06-2021 | Cash | 40,219.60 | |
| 11-24-2020 | Buy | 6.09 | 40,219.60 |
| 11-02-2020 | Cash | 37,910.64 | |
| 06-15-2020 | Buy | 13.15 | 37,910.64 |
| 06-15-2020 | Cash | 33,504.96 | |
| 06-01-2020 | Buy | -0.47 | 33,504.96 |
| 04-22-2020 | Cash | 33,663.19 | |
| 03-05-2020 | Sell | 3.2 | 33,663.19 |
| 03-05-2020 | Cash | 32,620.29 | |
| 11-01-2019 | Buy | 4.94 | 32,620.29 |
| 10-01-2019 | Cash | 31,083.42 | |
| 09-05-2019 | Buy | -1.56 | 31,083.42 |
| 08-23-2019 | Cash | 31,574.70 | |
| 08-19-2019 | Buy | -2.69 | 31,574.70 |
| 08-05-2019 | Cash | 32,447.60 | |
| 06-13-2019 | Buy | -0.28 | 32,447.60 |
| 05-13-2019 | Cash | 32,537.31 | |
| 02-07-2019 ** | Buy | 5.18 | 32,537.31 |
| 01-22-2019 | Sell | -3.78 | 30,934.49 |
| 01-03-2019 | Cash | 32,150.43 | |
| 01-02-2019 | Sell | -1.2 | 32,150.43 |
| 12-21-2018 | Cash | 32,539.79 | |
| 12-21-2018 | Buy | -1.86 | 32,539.79 |
| 12-03-2018 | Cash | 33,155.65 | |
| 11-07-2018 | Buy | -1.49 | 33,155.65 |
| 11-02-2018 | Cash | 33,658.83 | |
| 10-22-2018 | Sell | -0.2 | 33,658.83 |
| 10-12-2018 | Cash | 33,725.82 | |
| 10-10-2018 | Sell | 3.18 | 33,725.82 |
| 10-09-2018 | Buy | -1.25 | 32,685.95 |
| 10-04-2018 | Sell | 2.35 | 33,100.87 |
| 07-18-2018 | Buy | 1.57 | 32,341.10 |
| 07-16-2018 | Cash | 31,839.72 | |
| 07-03-2018 | Sell | -3.14 | 31,839.72 |
| 06-25-2018 | Cash | 32,870.42 | |
| 06-20-2018 | Buy | -1.72 | 32,870.42 |
| 06-19-2018 | Cash | 33,447.10 | |
| 06-01-2018 | Buy | 2.3 | 33,447.10 |
| 05-07-2018 | Cash | 32,695.86 | |
| 05-01-2018 | Sell | -2.76 | 32,695.86 |
| 04-24-2018 | Cash | 33,622.48 | |
| 04-10-2018 | Buy | -1.23 | 33,622.48 |
| 04-03-2018 | Sell | -2.49 | 34,041.41 |
| 03-26-2018 | Cash | 34,912.41 | |
| 03-23-2018 | Sell | -1.17 | 34,912.41 |
| 03-19-2018 | Cash | 35,326.29 | |
| 03-09-2018 | Buy | -1.71 | 35,326.29 |
| 02-05-2018 | Cash | 35,941.57 | |
| 12-27-2017 | Buy | 1.05 | 35,941.57 |
| 11-29-2017 | Cash | 35,566.64 | |
| 09-08-2017 | Buy | 6.81 | 35,566.64 |
| 08-21-2017 | Cash | 33,298.27 | |
| 08-18-2017 | Buy | -0.91 | 33,298.27 |
| 08-17-2017 | Cash | 33,603.45 | |
| 08-16-2017 | Buy | -1.33 | 33,603.45 |
| 08-10-2017 | Cash | 34,055.59 | |
| 07-11-2017 | Buy | 1.79 | 34,055.59 |
| 06-29-2017 | Cash | 33,456.13 | |
| 06-15-2017 | Buy | -1.03 | 33,456.13 |
| 06-14-2017 | Cash | 33,802.95 | |
| 04-25-2017 | Buy | 2.56 | 33,802.95 |
| 04-20-2017 | Cash | 32,958.48 | |
| 04-18-2017 | Sell | -1.46 | 32,958.48 |
| 01-31-2017 | Buy | 4.05 | 33,447.07 |
| 01-30-2017 | Cash | 32,144.38 |
In this Era of QE, since late 2008 when QE began, the steeper the drop, the greater the upside since tech-driven major averages such as TECL often hit new highs often within a few months of the typical 'V' bottom. Because of this, some start buying the further major indices fall then, as they make new highs, profits are slowly taken. It's an entirely different dynamic but suits some investors' risk tolerance preferences. Some use the MDM in this manner so if its losses exceed a certain amount during a buy signal, they first sell their position then start to slowly buy if the market continues to fall even if the model stays on a cash signal. Likewise, they may start to take partial profits as the market continues to make new highs on a buy signal. Since markets inevitably make major lows or highs, this is a way to increase profits overall. Further, when the rate of global liquidity (money printing across central banks) is accelerating, the model is far more likely to go from buy to cash (instead of sell) back to buy as it did through most of 2020 and 2021.