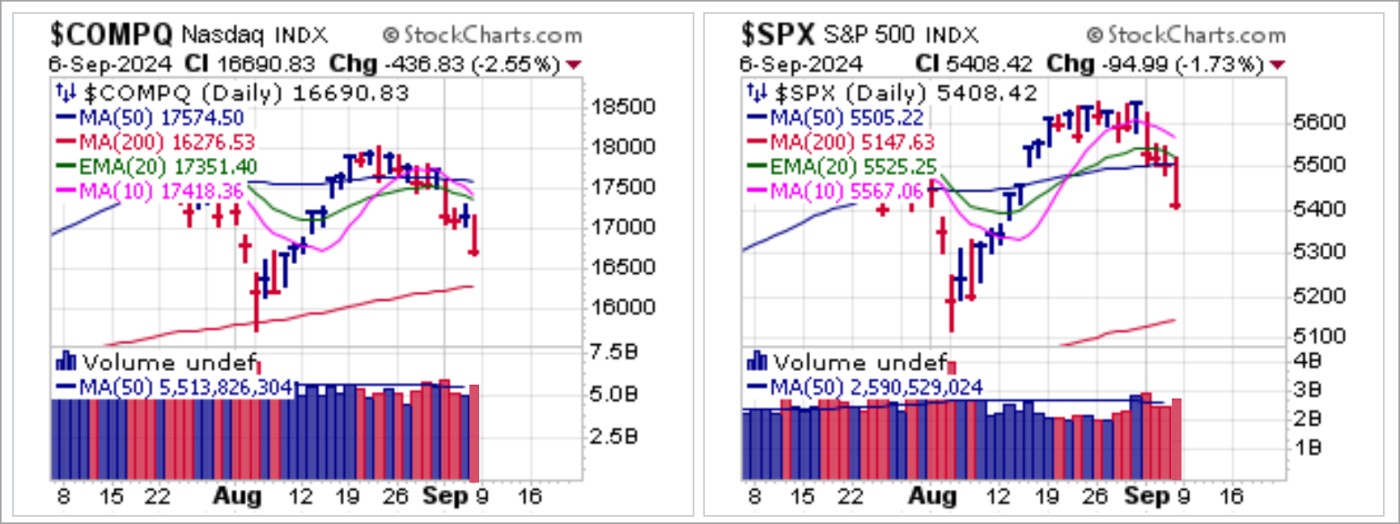
Major market indexes sold off hard this past week, with the tech-centric NASDAQ Composite and S&P 500 sliding lower all week long after both indexes broke below 20-dema support on Tuesday. The NASDAQ had previously broken below 50-dma support the prior week while the S&P 500 busted 50-dma support on Friday.
Overall, very bearish action, but as we noted last weekend, "The current market rally has been primarily an index phenomenon as the situation underneath the surface with respect to individual stocks remains murky and mostly undeveloped." As it turned out, things developed quite bearishly during this past week following that comment.
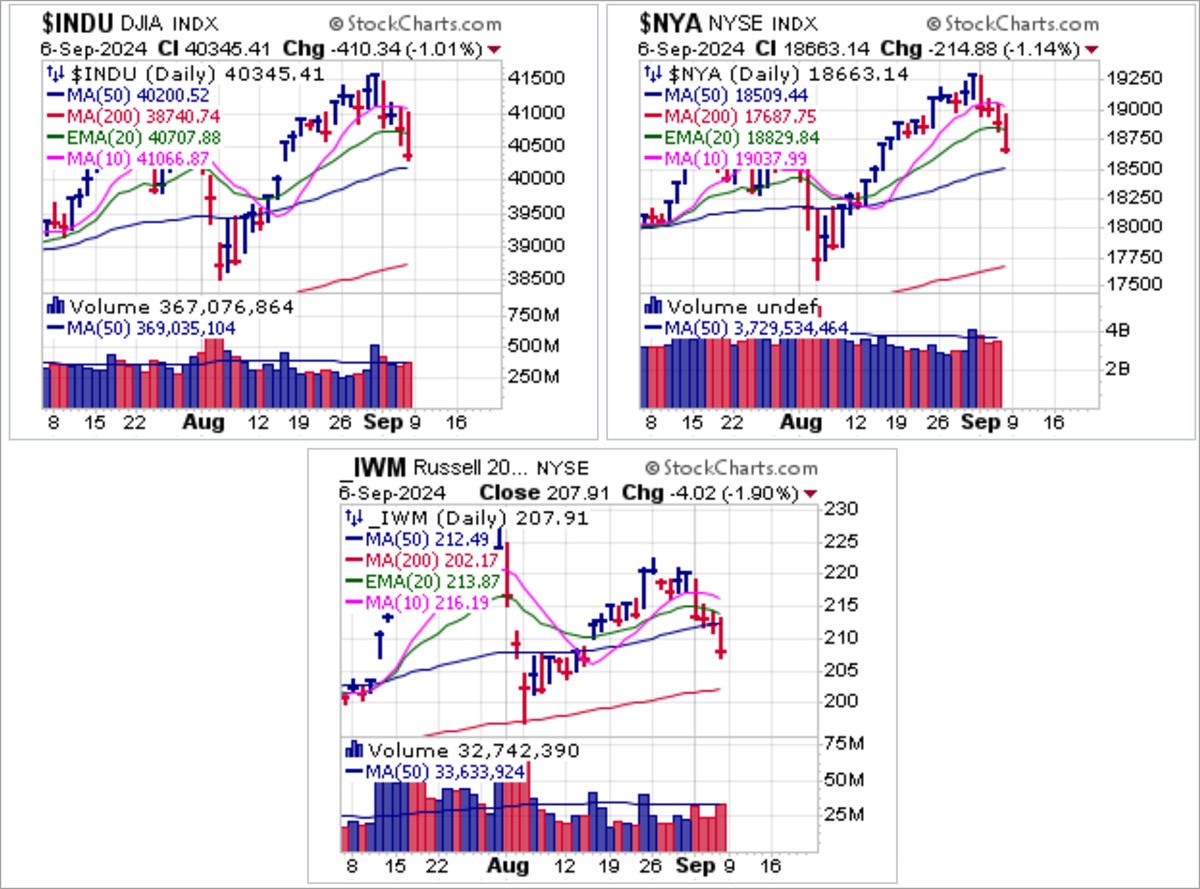
 The less tech-centric indexes the Dow, the NYSE Composite, and the small-cap Russell 2000 all rolled over this week with the Dow posting a double-top on Tuesday and the NYSE Composite a double-top on Friday. They both then went on to break 20-dema support on Friday as they posted lower lows for the week. The Russell 2000 as represented by the iShares Trust Russell 2000 ETF (IWM) broke 20-dema support on Tuesday and then ended the week below 50-dma support.
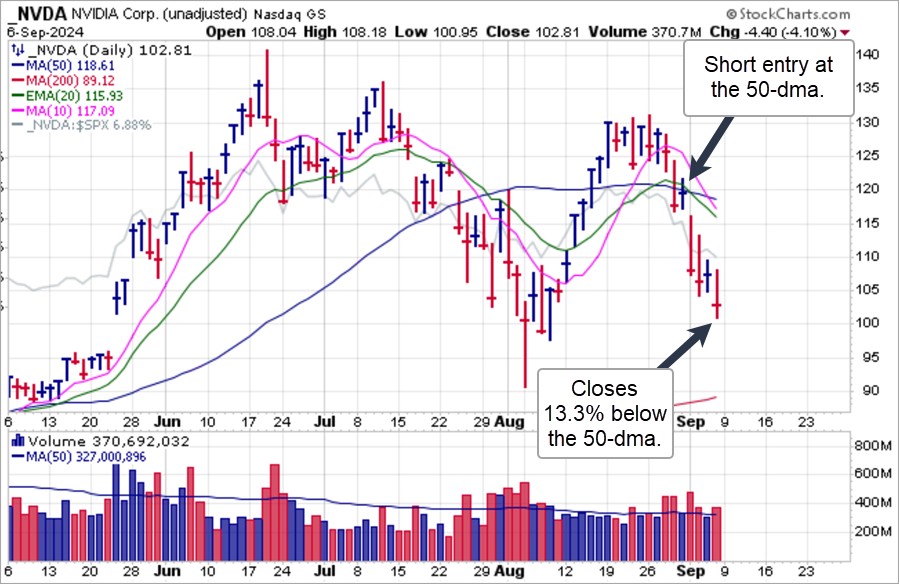
 Tech stocks led the downside this past week, with leading big-stock AI-Meme Semiconductor Nvidia (NVDA) setting the tone after reporting earnings last week. We reported on NVDA two Fridays ago when it set up as a short-sale entry just below the 50-day moving average. Since then it has trended lower all week long to post a lower low on Friday. As a very effective short-sale target it is now extended on the downside.
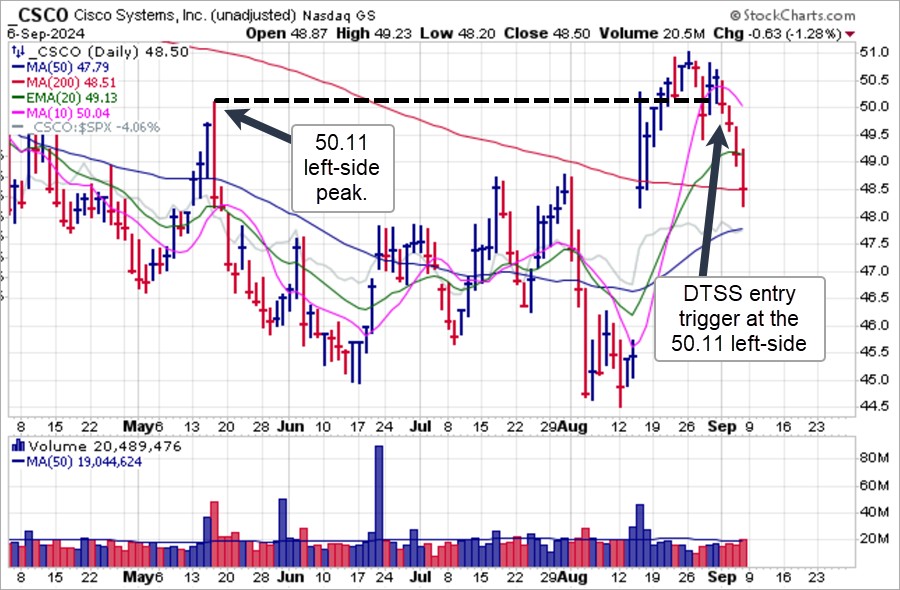
 On the same day that we reported on NVDA as a short-sale entry just below 50-dma resistance, we also reported on Cisco Systems (CSCO) as it hovered above the 50.11 left-side peak in its pattern. As we noted at the time, any break below the 50.11 price level would trigger a double-top short-sale (DTSS) entry using the 50.11 price level as a tight covering guide. CSCO broke below 50.11 on Tuesday and continued lower all week before finally shaking out and holding 200-dma support, for now.
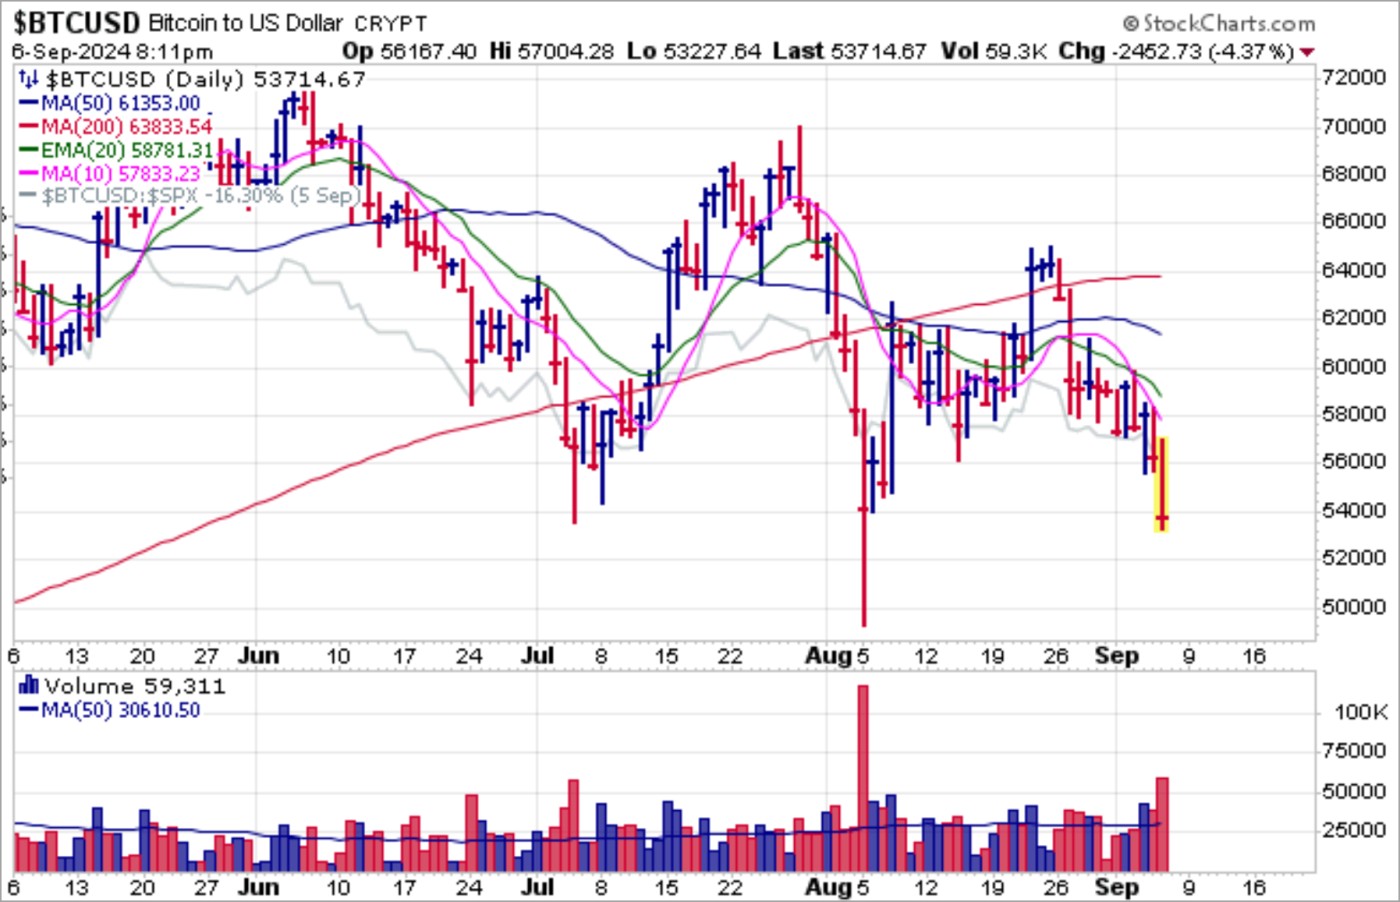
 Bitcoin ($BTCUSD) remains a bearish proposition. As we noted last week, it triggered various short entries the prior week as it first reversed back below 200-dma support and then busted the 50-dma and 20-dema in short order. It streaked to lower lows on Friday as it looks set to test the August 5th lows.
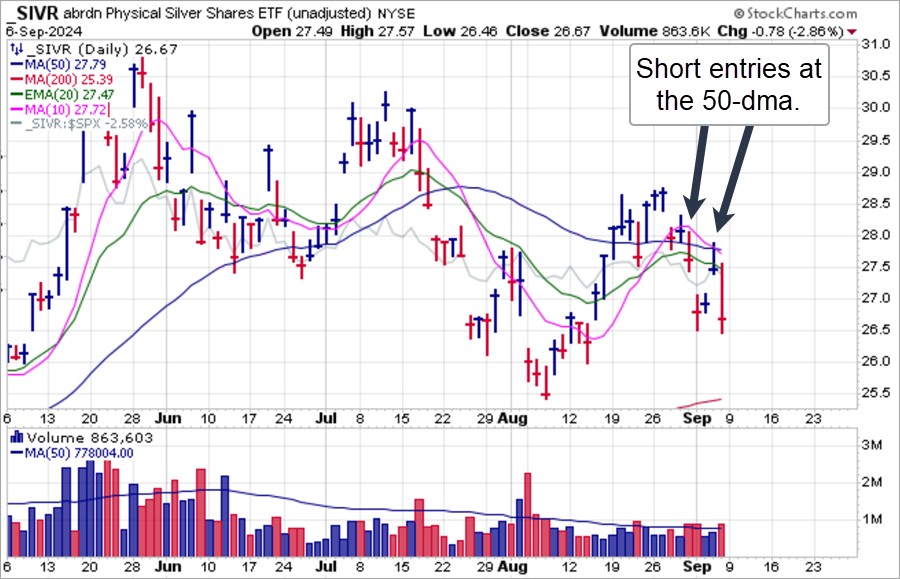
 Gold and silver have gone their separate ways, but as we noted last week, silver suffers from the fact that it is not gold, that is less of a monetary metal and more of an industrial one. It triggered a short-sale entry at the 50-dma two Fridays ago and then came back for a second short-sale entry as it failed to clear the 50-dma on Wednesday. From there silver as illustrated by the daily chart of the Aberdeen Physical Silver Shares ETF (SIVR) has declined back to the lows of this past Tuesday as it appears headed for a test of the 200-dma.
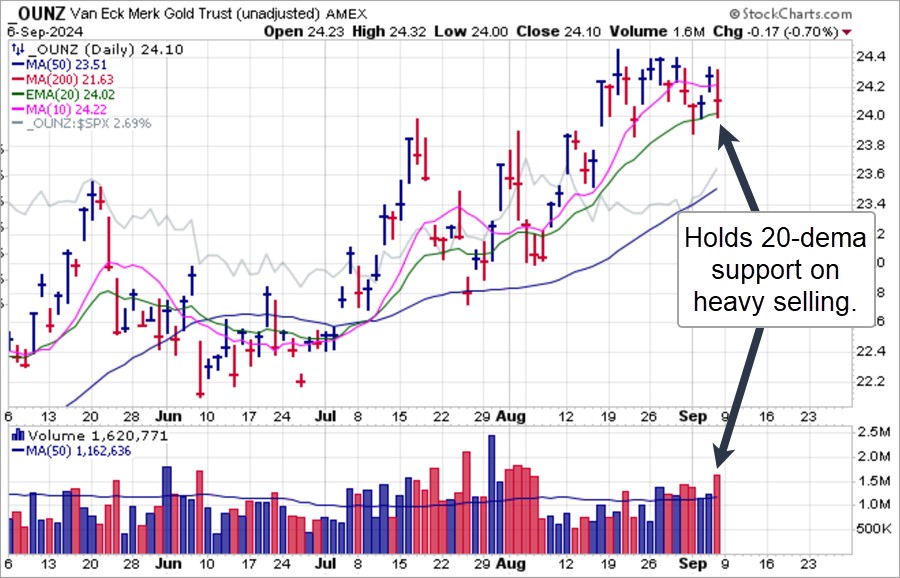
 Meanwhile holds up within a short consolidation as it weathers repeated selling down to the $2,500 level on the December Futures contract. Here we see the VanEck Merk Gold Trust (OUNZ) tested 20-dema support three out of four days this past week and held, with all three moves constituting moving average undercut & rally (MAU&R) long entries at the 20-dema which is then used as a tight selling guide.
Both gold and silver got a big boost from news overnight Wednesday into Thursday morning that Russia intends to buy $1.9 billion worth of gold bullion during the month of September. Central bank gold buying has been a persistent occurrence in 2024 as central banks of China, Russia, India, Turkey, Uzbekistan, Poland, Jordan, Czechoslovakia, and Qatar, among others move to shore up and expand their gold reserves. This is why gold is now the #2 reserve asset at 16.6% vs. the third-ranked reserve asset, the Euro at 15.9%.
The Market Direction Model (MDM) switched to a SELL signal on Thursday, September 5th.
