Major market indexes melted higher all week long. Both the Consumer Price Index and the Producer Price Index came in slightly above estimates, with core CPI and PPI both printing 0.3% vs. estimates of 0.2%. The NASDAQ Composite and S&P 500 regained their 50-day moving averages as they wedged higher and towards their prior August highs on declining volume.
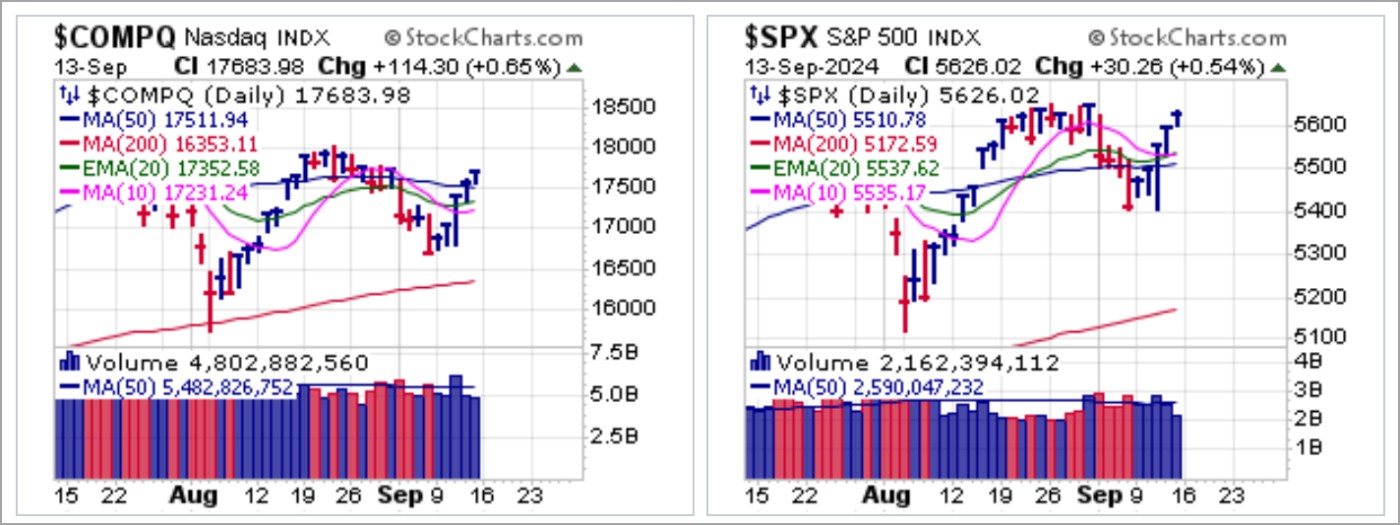 Similar wedging action is seen in the Dow and NYSE Composite Indexes. Both in fact posted moving average undercut & rally (MAU&R) moves on Wednesday at their 50-day moving averages and have rallied sharply higher since then. They too are approaching prior August highs.
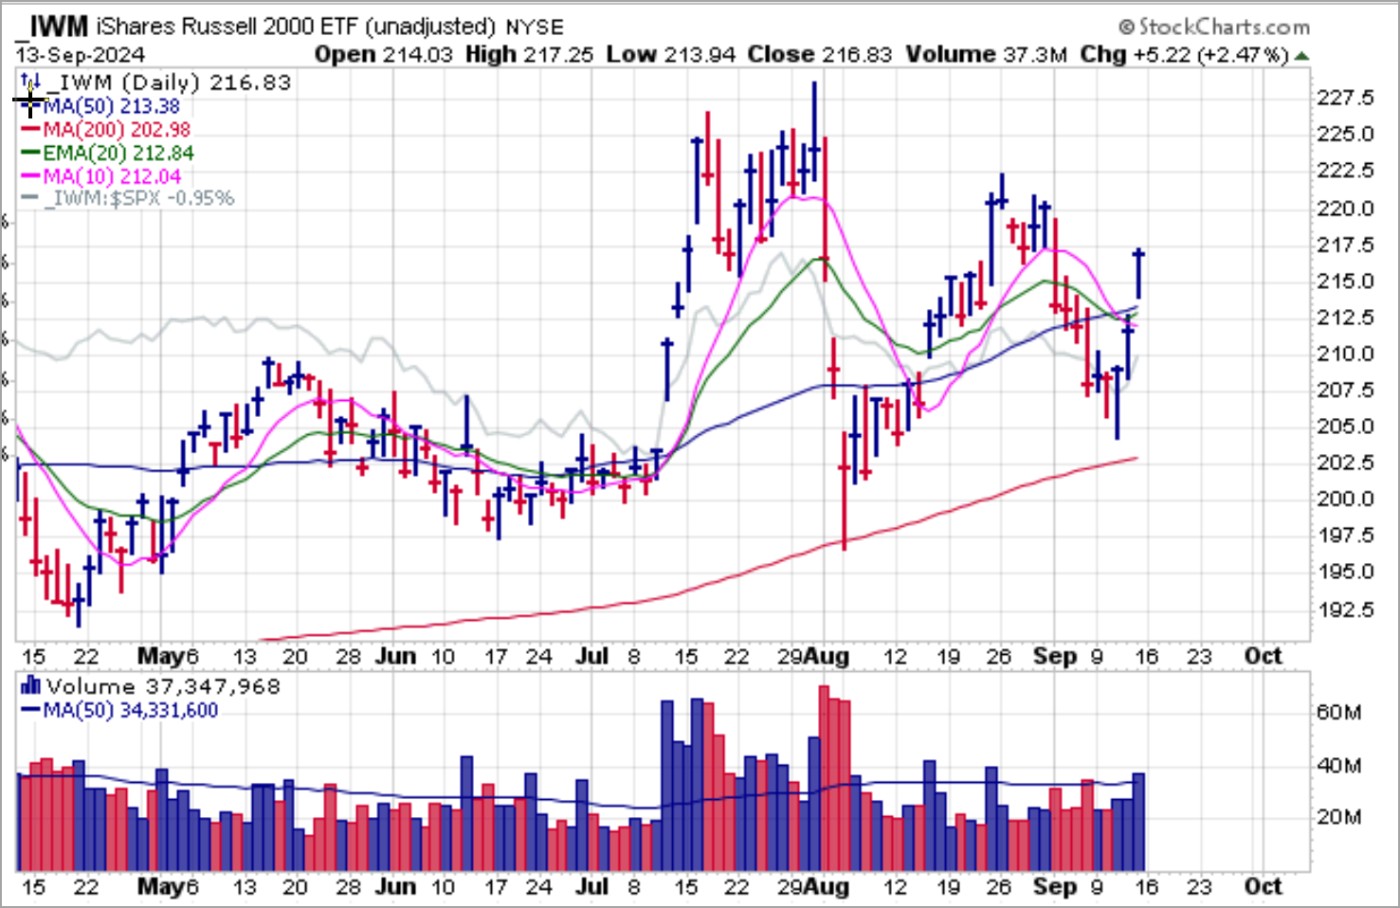
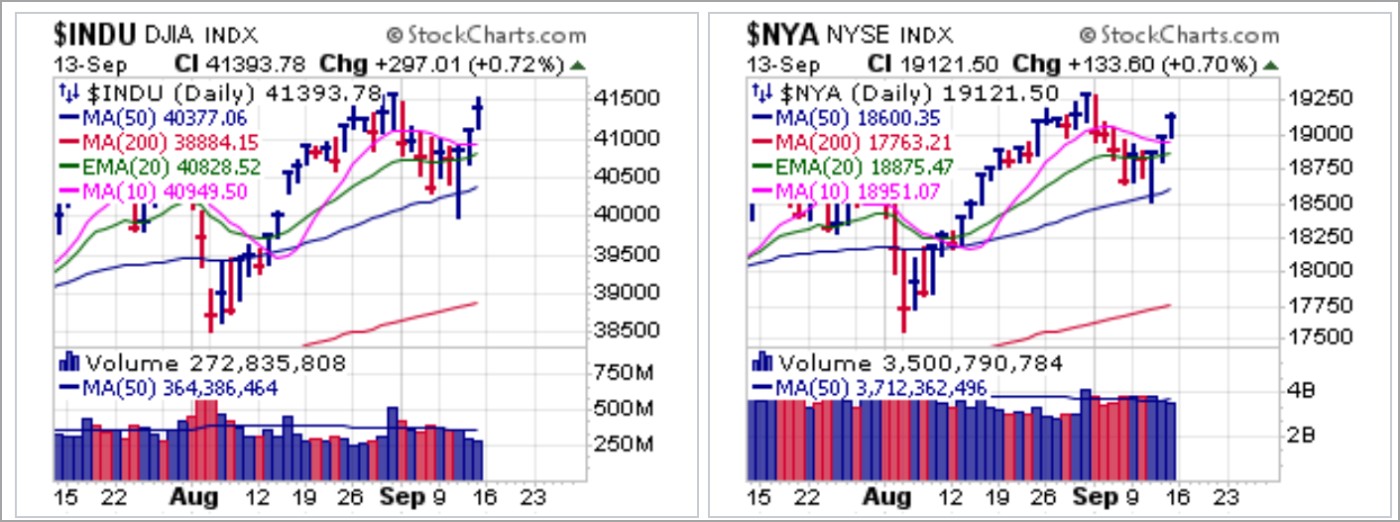 The small-cap Russell 2000 was the only outlier as the iShares Russell 2000 ETF (IWM) moved higher on strong volume on Friday.
 Certainly, the slightly hot CPI and PPI prints this past week were not bullish for stocks any more than they were bullish for precious metals, They were not necessarily bearish for interest rates as measured by the 10-Year Treasury Yield ($TNX) or the U.S. Dollar ($USD). Yet interest rates and the dollar ended the week near recent lows.
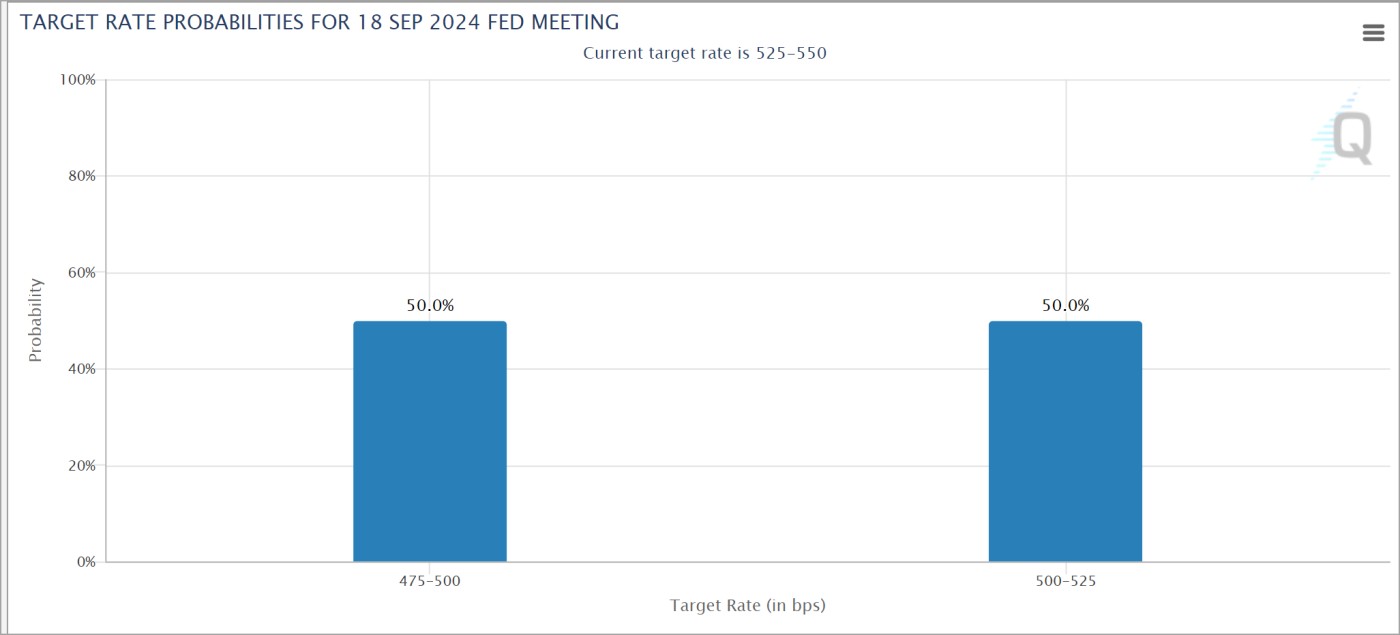
 The market has apparently figured out that despite persistent inflation, weakening jobs numbers seen the prior week in the ADP Employment Change and the mostly fictional Bureau of Labor Statistics jobs report are further evidence of a rapidly weakening economy. Thus, the market expects the Fed to lower rates faster than even the Fed expects. At the same time, the Fed must address the rapidly accelerating interest expense on the $35.4 trillion debt. Two weeks ago the market was expecting that a 25-basis point rate cut was the higher probability at 71.5% vs. 28.5%.
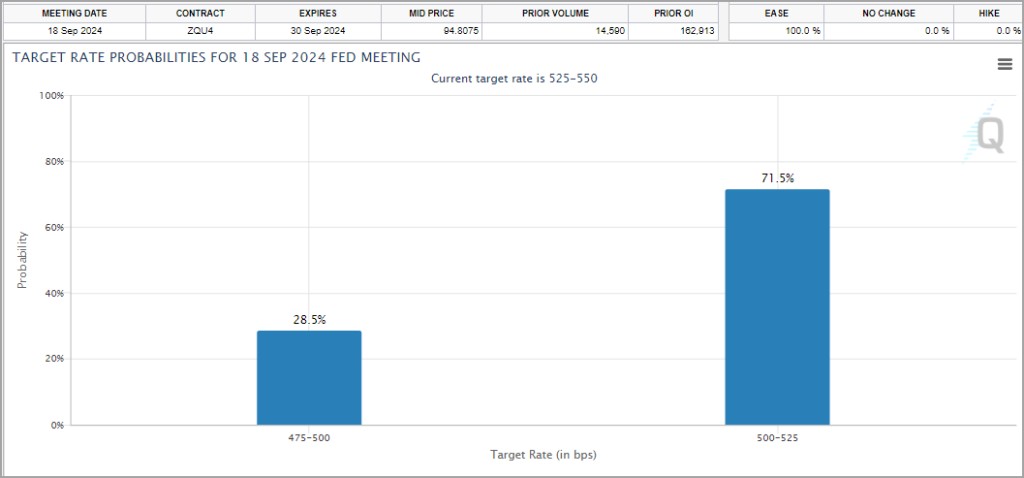 The most current data shows that market participants now ascribe even odds between at 25- and 50-basis point rate cut this coming Wednesday when the Fed issues its latest policy announcement. So it is clear that the market sees something on the horizon that the Fed will have to address, or at least seriously consider addressing at this week's policy meeting and announcement..
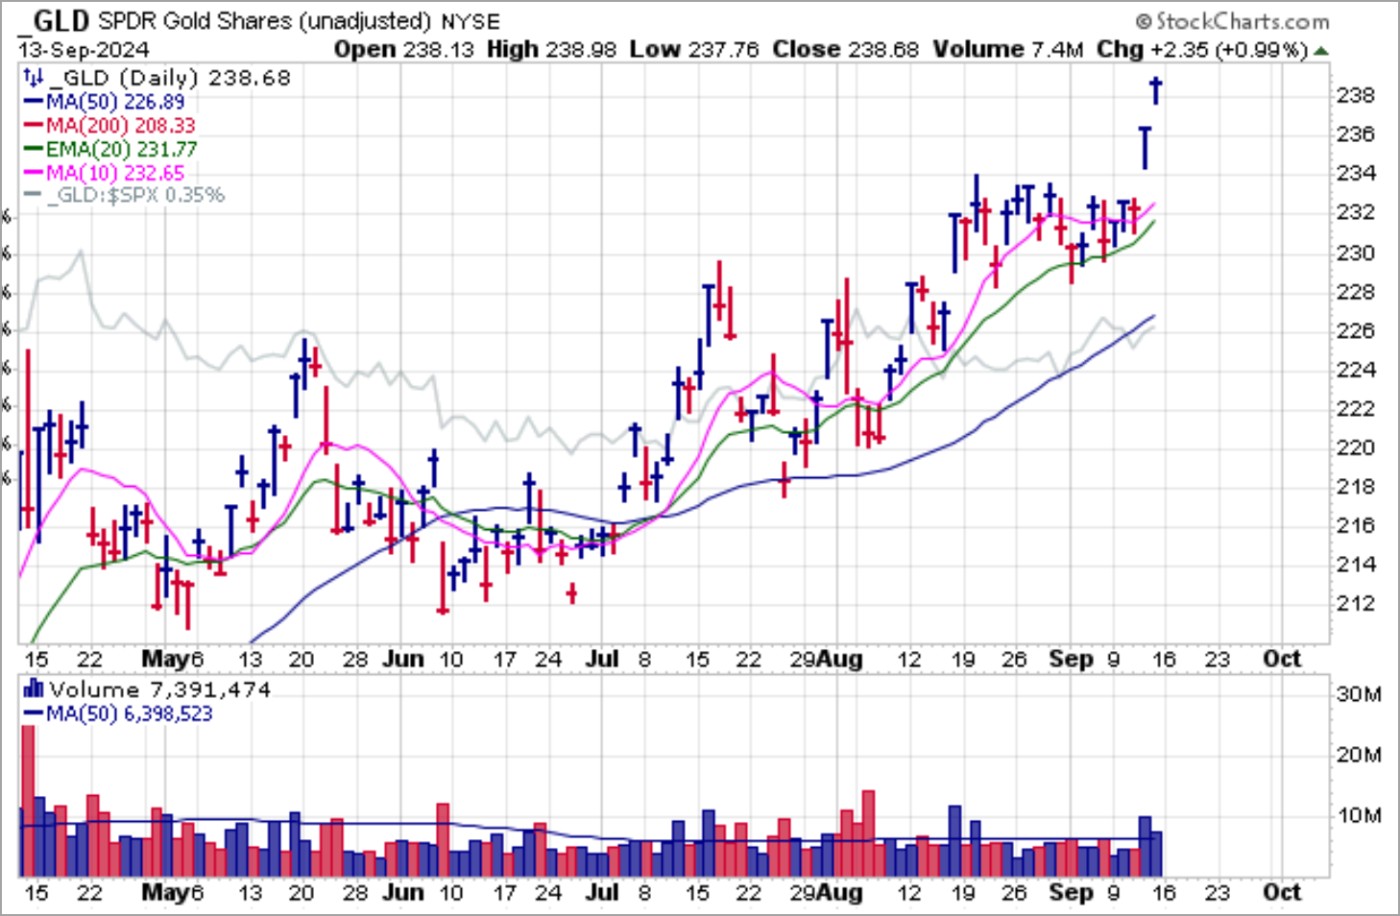
 Gold concurs as it posted a new all time high on Thursday and continued higher by Friday as December futures closed at an all-time record high of $2,606.20 an ounce. The move on Thursday morning in the SPDR Gold Trust (GLD) was a typical buyable gap-up move, although it in fact started the night before as futures rallied in the overnight session. We have noted previously that gold has been coiling in a tight range along 10-dma and 20-dema support as well as it rapidly rising status as the #2 reserve asset in the world behind the U.S. dollar and ahead of the euro.
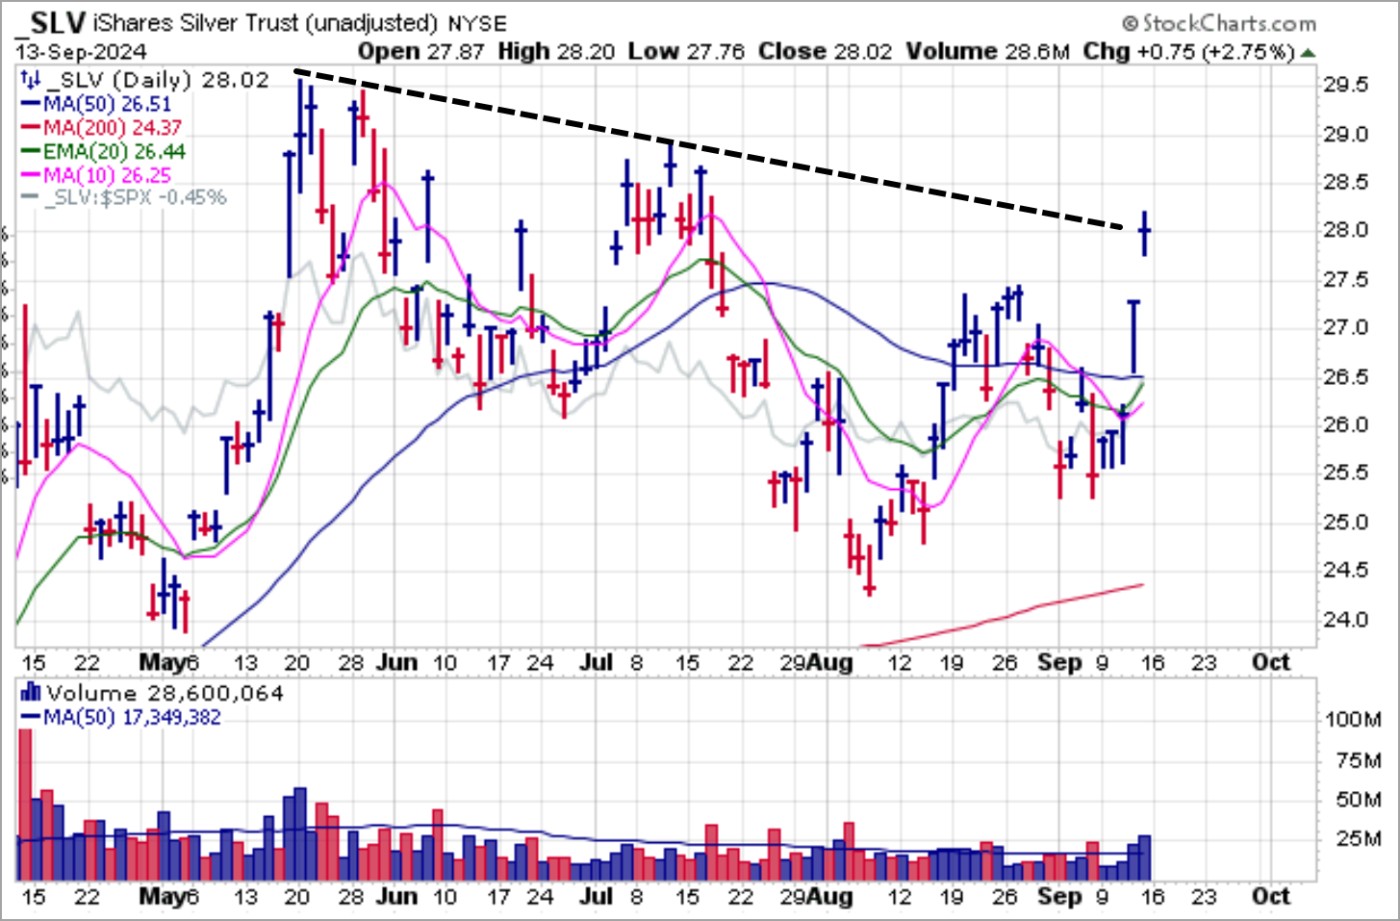
 Silver followed gold's lead to post moving average undercut & rally (MAU&R) moves at its 20-dema and then 50-dma on Wednesday and Thursday before continuing higher on Friday. The iShares Silver Trust (SLV) gapped up twice to end the week as silver futures ended the week at $31.075 where it encountered declining tops trendline resistance on Friday.
 Rising gold prices have in turn triggered sharp moves in gold mining stocks, most of which have bounced sharply off moving average support, primarily at the 10-week moving average on the weekly charts as shown below.
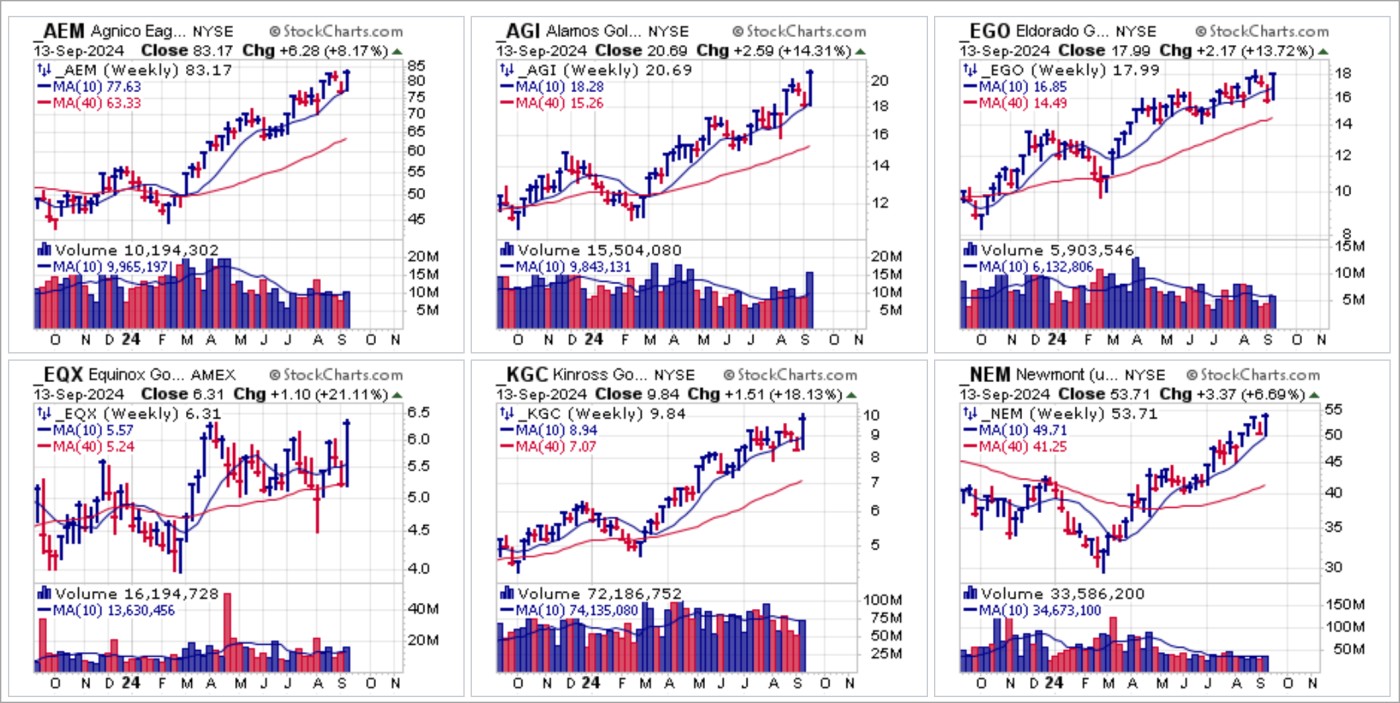 In the same manner, the sharp upside move in silver this past week has triggered even sharper upside moves in leading silver miners as they post strong-volume breakouts
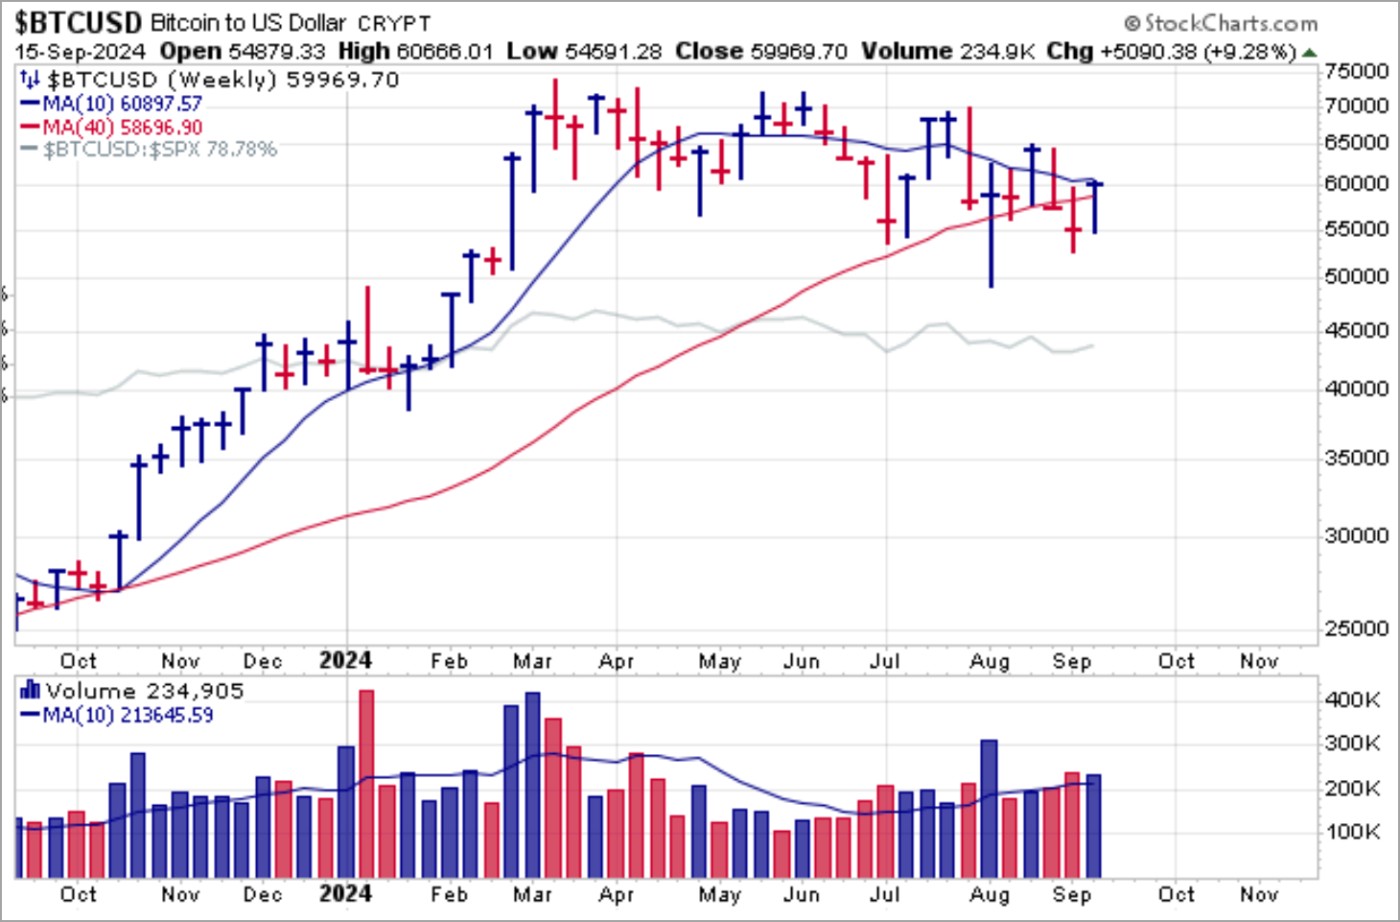
 Bitcoin ($BTCUSD) continues to wander about as it appears to mostly directionless. This week's Fed policy announcement could provide a catalyst for a more decisive resolution to $BTCUSD's current 27-week long consolidation that has seen a lot of choppy volatility as expressed by the 33% range between the highs and lows.
 While major market indexes have held their rallies off the lows of two weeks ago, underneath the surface, individual stocks, including formerly leading techs, remain unresolved. Wednesday's Fed policy announcement will likely provide a catalyst for a resolution, so will certain be the main event this week. The Market Direction Model (MDM) switched from SELL to BUY on Wednesday, September 11, 2024