
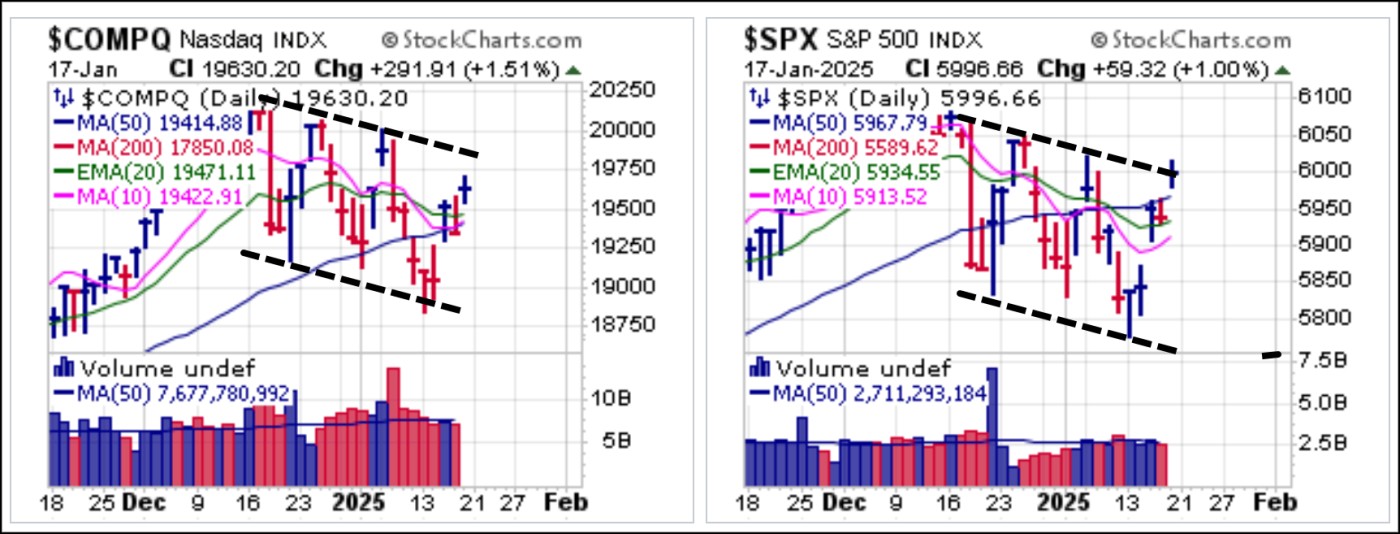
Light inflation data from the PPI on Tuesday and the CPI on Wednesday urged the markets higher as both the NASDAQ Composite and S&P 500 have reached the top of their current downward trend channels. Note the price U&R in the S&P 500 on Monday at the lower boundary of the downward trend channel. That led to the current rally that now sits at potential trendline resistance.
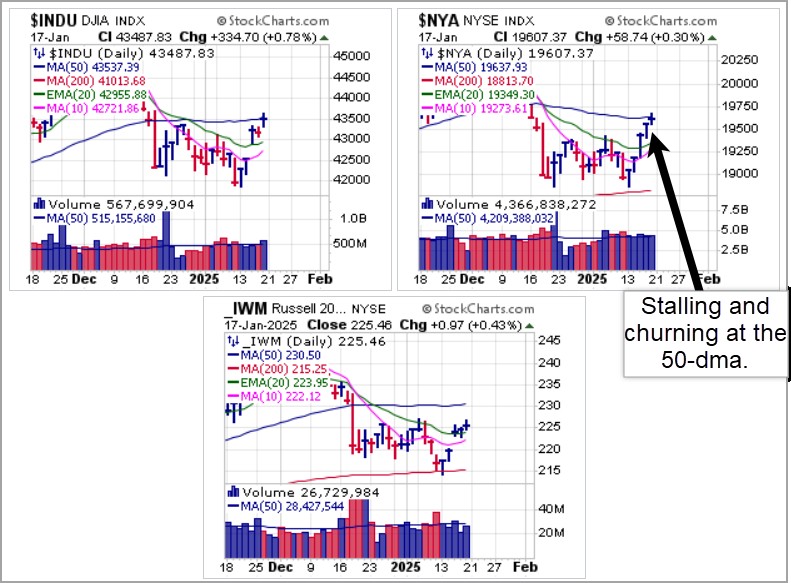
The broader market has participated in the market reaction rally over the past week as evidenced by the action of the Dow, the broad NYSE Composite, and the small-cap Russell 200 Index as represented by the iShares Russell 2000 ETF (IWM). Both the Dow and the NYSE Composite posted price U&Rs at their December 20th lows on Monday and have now both rallied into 50-dma resistance where they stalled and churned on Friday's options expiration.
 Despite the allegedly bullish PPI and CPI data this past week, we can see that total CPI continues to rise as the slope of the line on the chart below shows an increasing slope and is therefore reaccelerating. Price levels continue to rise, and despite how the Fed tries to spin it, they have absolutely not brought inflation under control. Persistent inflation and how the Fed reacts could figure significantly into market outcomes in 2025.
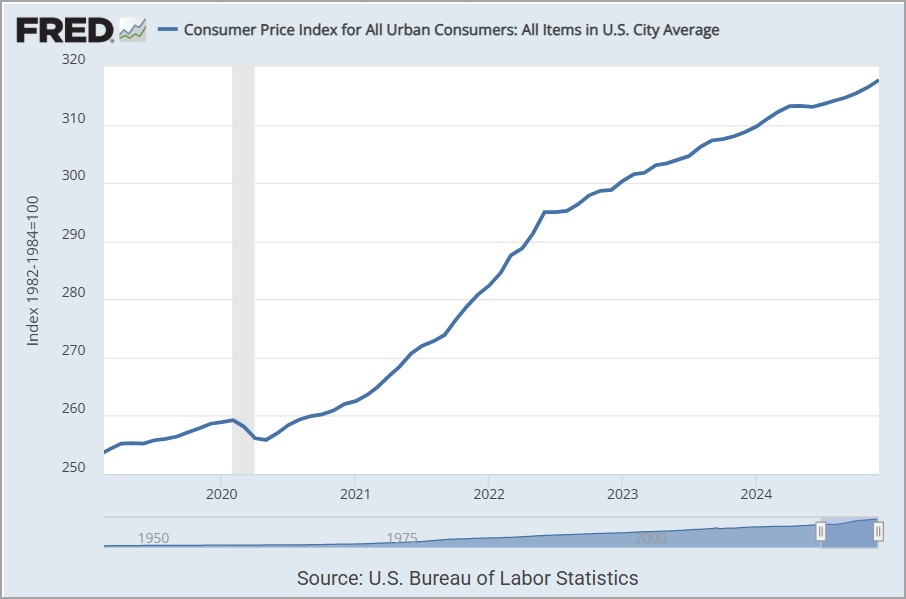 Interestingly, Bitcoin ($BTCUSD) posted a price U&R along its own prior support lows in the $91,000-$92,000 price zone on Monday at the same time that certain major market indexes posted U&Rs as well. As we have noted in recent Focus List Review reports, price support appears to be more important than moving average support. While $BTCUSD looked like it was forming a fractal head & shoulders pattern as of last week, the break below the neckline on Monday only served as a fake out leading to a U&R move as it now pushes back to the prior highs ahead of incoming President Trump's inauguration on Monday.
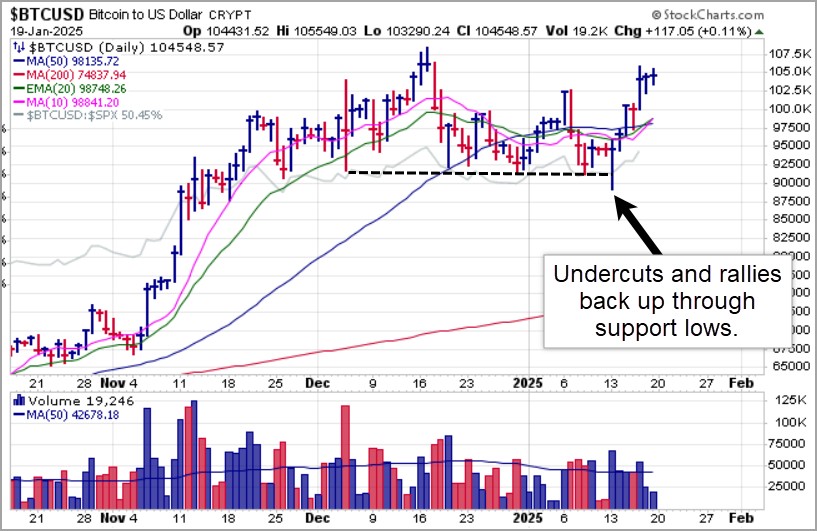 Precious metals gold and silver also rallied this past week, building on the moves they have had off the lows over the past 2-3 weeks. Gold is now less than 2% away from its all-time highs while silver chops its way higher and on Friday pulled into 50-dma support as volume declined.
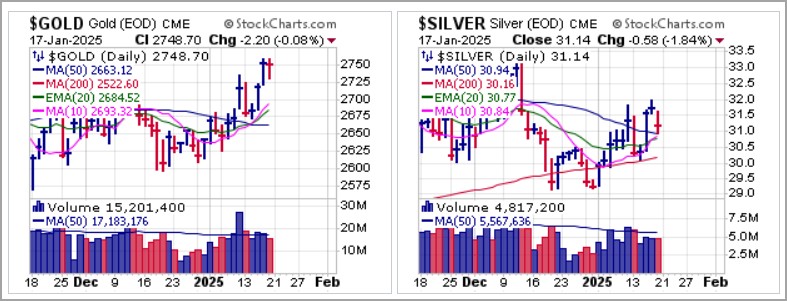
With respect to individual stocks, on Wednesday we reported on three potential short-sale set-ups in Adobe Systems (ADBE), Salesforce.com (CRM), Microsoft (MSFT) and ServiceNow (NOW) as they rallied into moving average resistance. At the time, ADBE and CRM were pushing into 10-dma resistance while MSFT and NOW were rallying into 50-dma resistance. As discussed in our book, Short-Selling with the O'Neil Disciples, market context is often critical in determining the success of potential short-sale set-ups. With the market rally persisting all week long, these four names continue higher into Friday.
By Friday, however, ADBE was stalling at higher 20-dema resistance and CRM has reversed at its own higher 20-dema resistance. MSFT on Friday posted a mini double-top short-sale (DTSS) set-up as it rallied past the 234.32 left-side peak of January 6th and reversed to trigger a DTSS entry. NOW was able to clear its 50-dma on Friday in a stalling range, so would only be actionable as a short if it reversed back below what is now 50-dma support.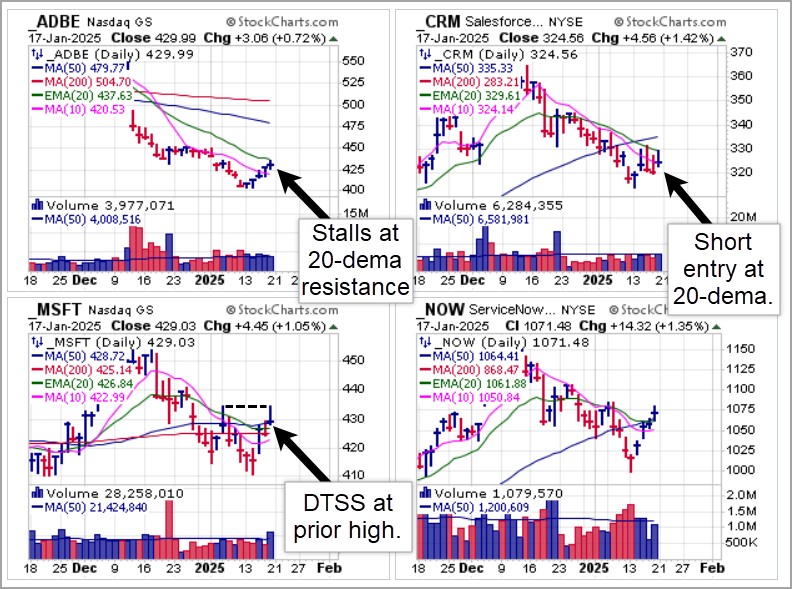
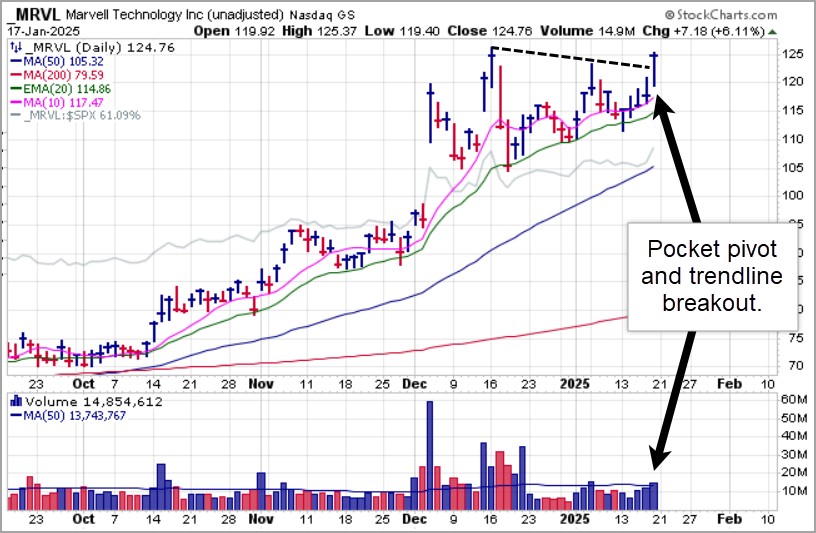
At the same time, we see some pockets (literally) of constructive action elsewhere in the market. On Friday, Marvell Technology (MRVL) posted a pocket pivot as it gapped off the 10-dma on a trendline breakout.
 We also saw a pocket pivot breakout in Credo Technology (CRDO) on Friday. Note, however, that two prior shakeouts along the 20-dema would have served as moving average undercut & rally (MAU&R) long entries each time using the 20-day line as a selling guide.
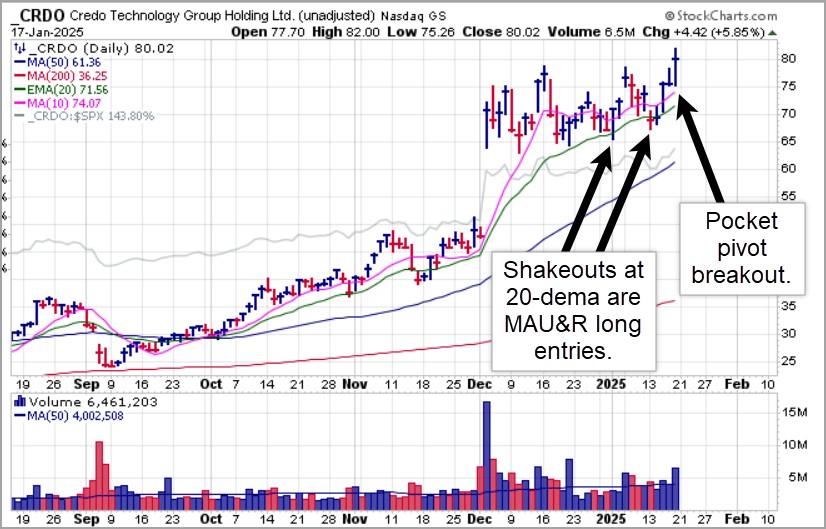 For now we view the market current market as mostly a trader's environment. Once the new Trump Administration has been sworn in and wound up to run in whatever new directions it settles upon we may begin to see more clarity in terms of sustainable trend one way or the other. The evidence on the NASDAQ and S&P 500 charts indicates nothing more than a very volatile range over the past month with no resolution beyond the boundaries of the current downward trend channel.
The Market Direction Model (MDM) remains on a CASH signal.