Major Market Indexes started the week off with a capitulatory sell-off on Monday morning after the Japanese Nikkei 225 Index had its biggest percentage sell off since October 1987 down 12.28%, and its largest-ever point-loss, down 4,451.28 points. That served as a catalyst for a panic low in U.S. markets on Monday morning that in turn set the stage for a logical oversold bounce. Stocks have been selling off for nearly the past month and Monday's gap down open that saw both the Dow and NASDAQ Composite indexes down over 1000 points at the open certainly had the look and feel of a near term, parabolic, climactic low coming at the end of a prior downtrend.
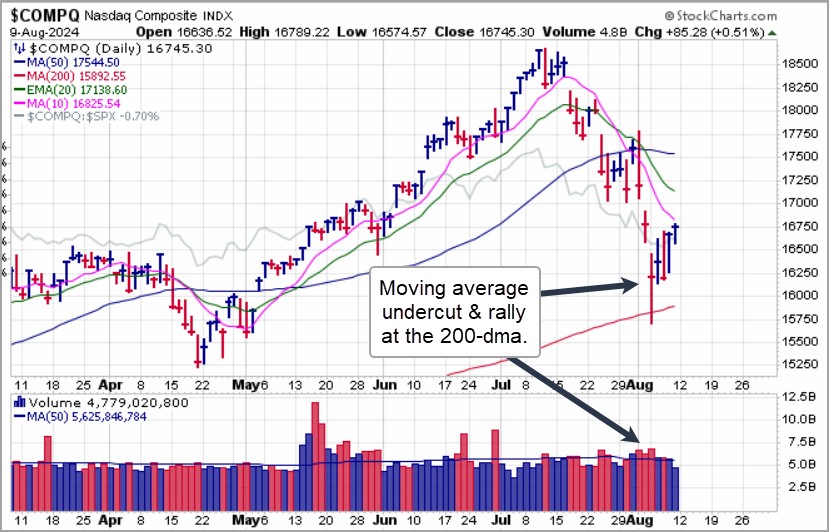
In the process, the NASDAQ Composite posted a moving average undercut & rally (MAU&R) move at its 200-day moving average on Monday.
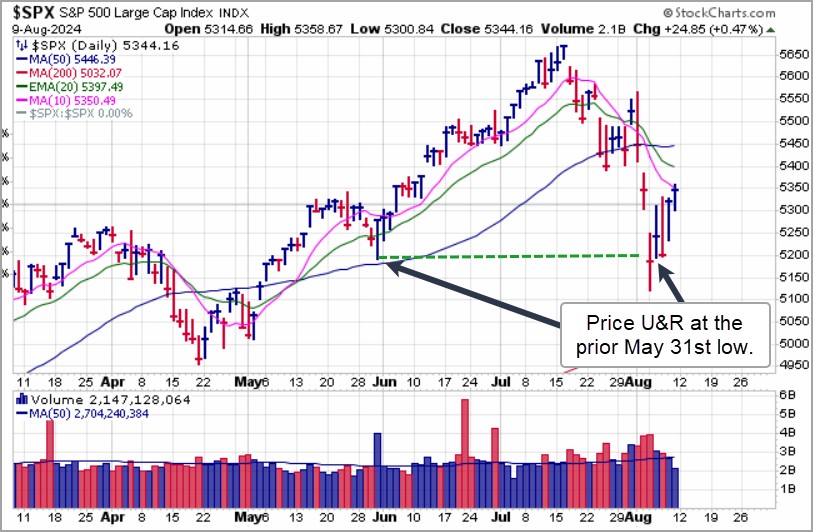
On Tuesday the S&P 500 posted a price undercut & rally (U&R) at its prior late May low, confirming at least a potential near-term low. The market ended the week in what is so far a five-day rally off the Monday intraday lows that remains in force for now. Note that volume is declining as the indexes bounce off Monday's lows, so some backing and filling could occur prior to a resolution one way or the other. The market situation remains tenuous.
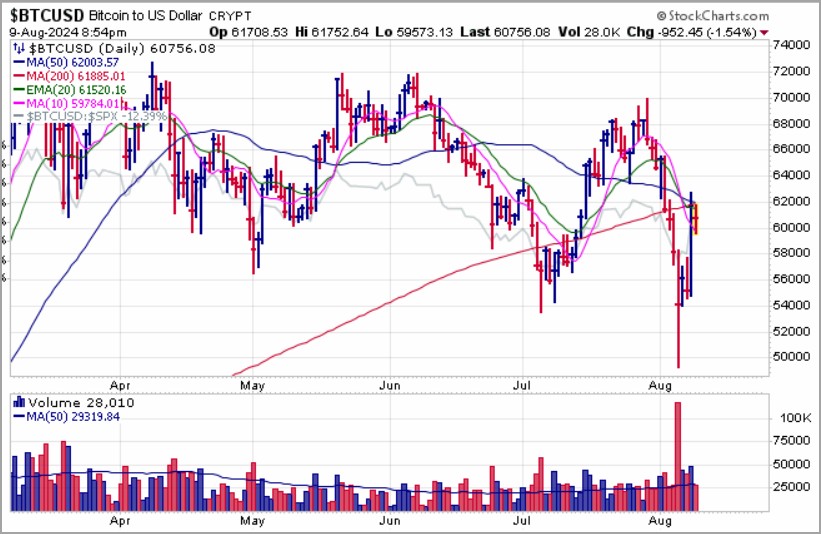
Bitcoin ($BTCUSD) rallied sharply on Thursday, running into moving average resistance at its 50- day and 200-day moving averages. It then backed off slightly on Friday. Technically, this would initially serve as a short sell entry using the two moving averages as covering guides.
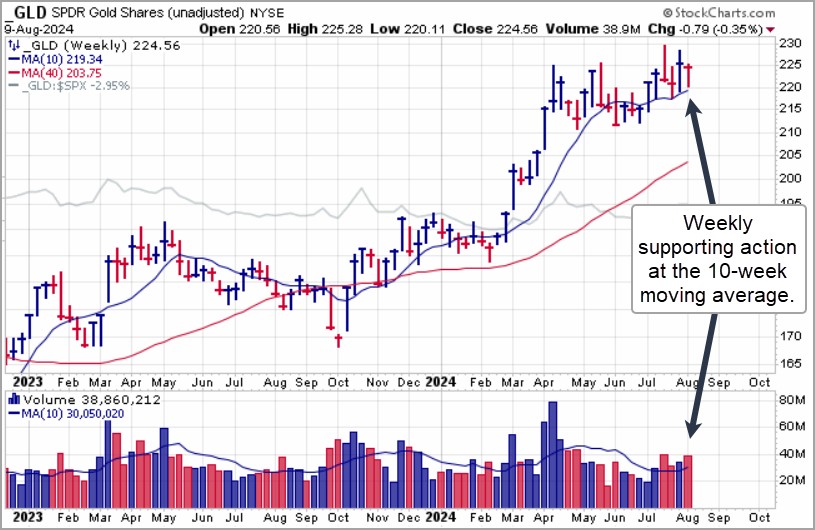
Gold continues to act well as it posted a moving average undercut & rally through the 20-day exponential moving average on Thursday. The weekly chart of the SPDR Gold Trust (GLD) shows that it is building a constructive base as it appears to be setting up for a potential breakout to new highs. On balance it has held up much better than stocks during the severe and sharp selloff we have seen since the early July peak in stocks.
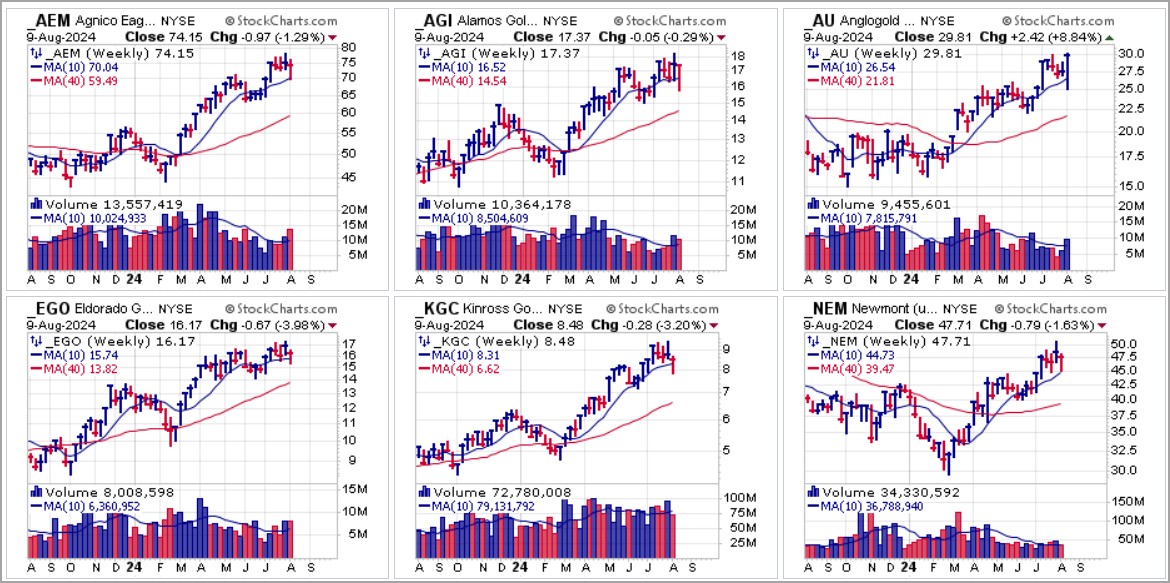
Interestingly, some of the best-looking charts in the current market environment can be found among the precious metals miners. A few examples are shown below on the weekly charts and include leaders in the group such as Agnico-Eagle Mines (AEM), AngloGold- Ashanti (AU), Alamos Gold (AGI), Eldorado Gold (EGO), Kinross Gold (KGC), Iamgold (IAG), and Newmont Corp. (NEM).
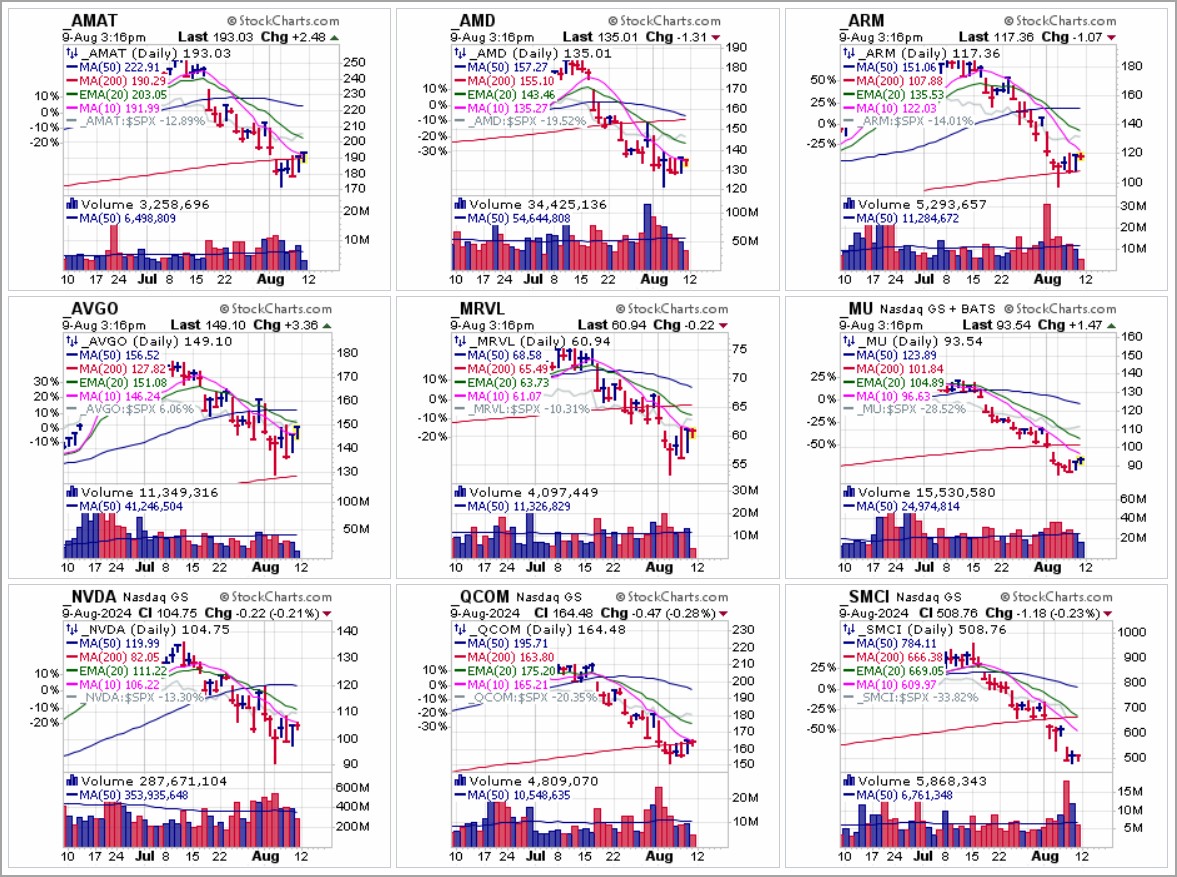
Nearly all prior leading stocks have been beaten to a pulp, particularly in the tech sector. The composite group chart below offers a sampling of some of these charts among key names in the sector, including Nvidia (NVDA), Arm Holdings (ARM), Super Micro Computer (SMCI), Applied Materials (AMAT), and Qualcomm (QCOM), to name a few.
The charts speak for themselves and mostly reveal that the patterns of the majority of beaten-down former tech leaders, at best, may need time to heal before we would be comfortable taking positions for an intermediate-term move. The current oversold bounce could end quickly and result in moves lower so we believe that risk remains quite high in this market.
The Market Direction Model (MDM) switched to a SELL signal on Monday, August 5th, 2024, then switched back to a BUY signal on Tuesday, August 6th, 2024. Volatility could easily return so position size accordingly. This is a unique time with the yen carry trade offsetting global markets and the Japanese Nikkei having its worst two days in its entire history. If the amount of stealth QE as discussed in our other reports is sufficient to address the soaring yen to prevent Japanese banks from selling U.S. Treasurys, the bounce could turn into a new uptrend where 'V' bottoms are formed as prior deep corrections have shown historically. But there are headwinds such as the slowing economy which could cause issues for technology stocks which have been overvalued and whether the soaring yen will abate. If markets make lower lows in rapid fashion, it would force the Fed's hand to issue sufficient QE as they have in times past such as in March 2020 (COVID) and March 2023 (bank failures) which would likely create a 'V' bottom.
