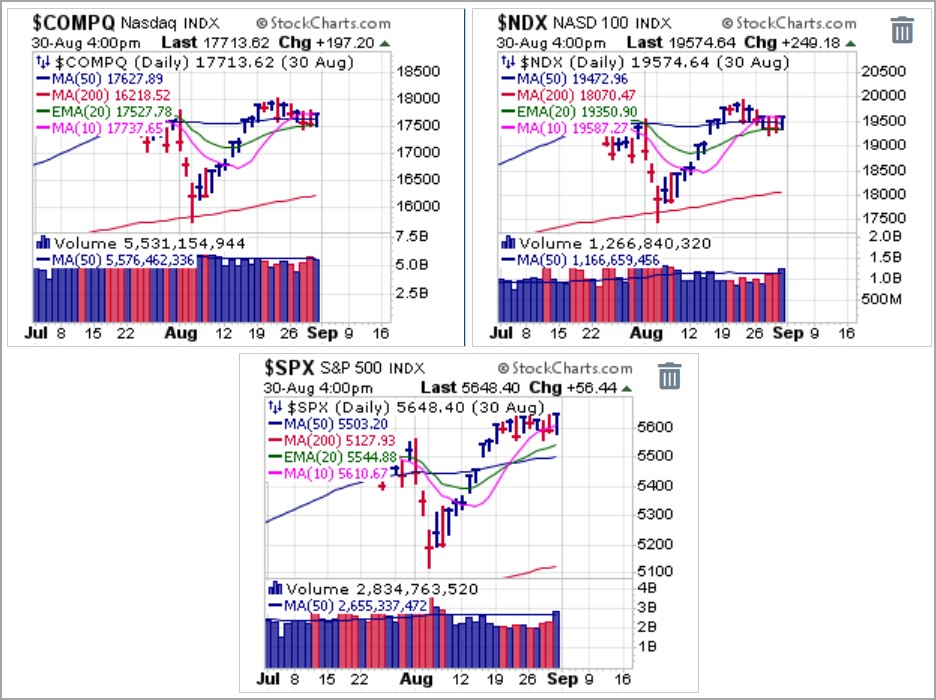
Tech-centric indexes spent the week moving sideways despite a great deal of intraday volatility. The NASDAQ Composite, NASDAQ 100, and S&P 500 all ended the week above their 50-dmas with the S&P approaching all-time highs once again.
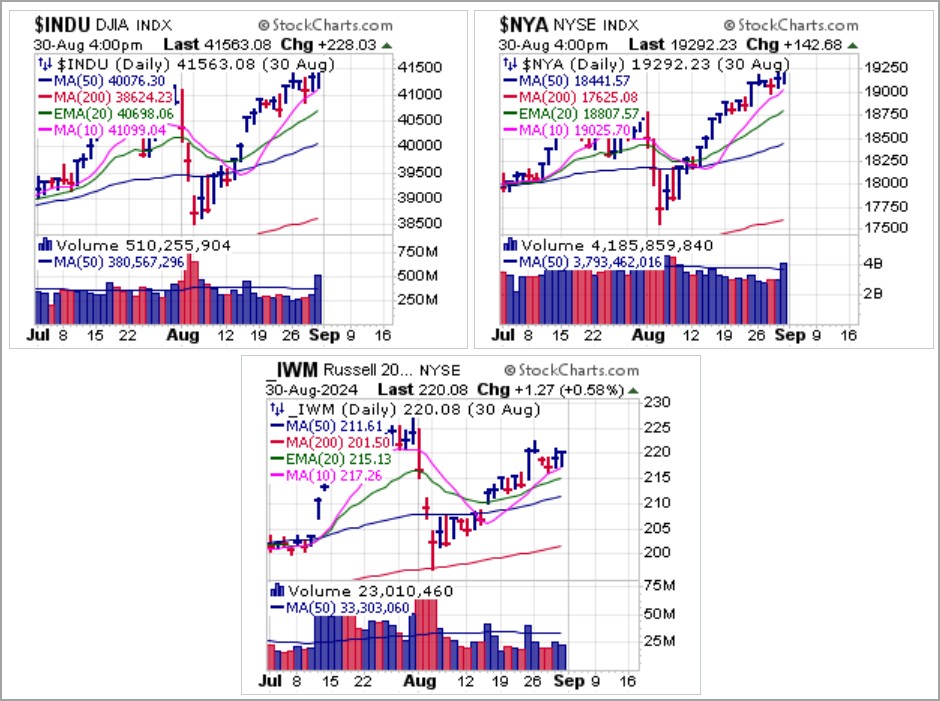
The Everything Else Indexes, as we refer to them, are acting much more strongly as the Dow and NYSE Composite posted all-time highs this week. The small-cap Russell 2000 spent the week in a short bull flag as it tracks along its 10-dma along with the Dow and NYSE Composite.
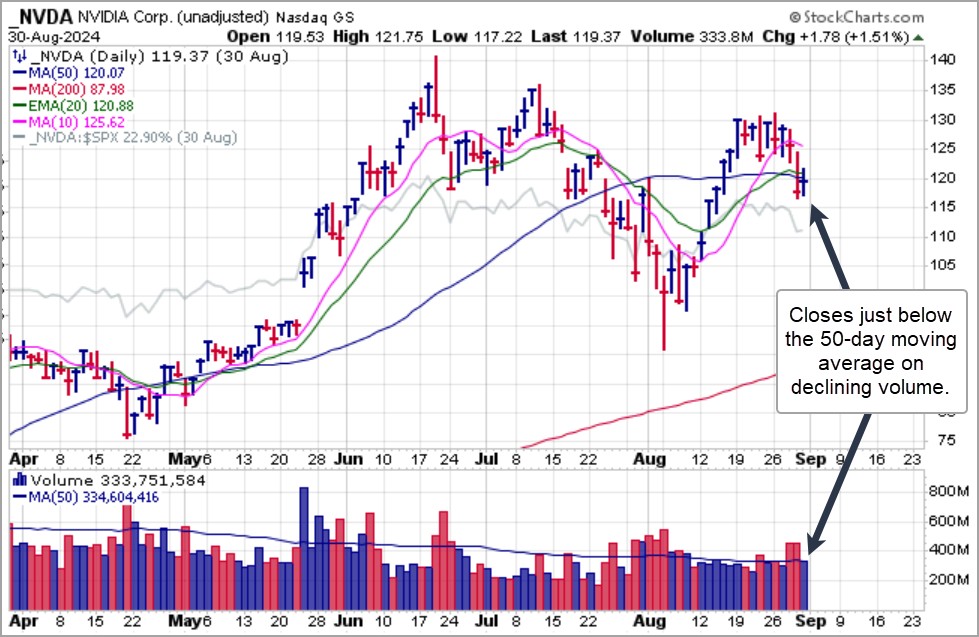
Underneath the surface of the market, significant profit opportunities are difficult to come by. Nvidia (NVDA) was supposed to a major market moving event when it reported earnings on Wednesday, but that played out as a nothing burger with NVDA pulling off a handful of percentage points while the market held relatively steady on Thursday. The stock ended the week just below its 50-dma which would trigger a technical short entry using the 50-dma as a covering guide. Otherwise, if NVDA can quickly regain its 50-dma it would trigger a potential moving average undercut & rally (MAU&R) long entry where the 50-day line is used as a selling guide.
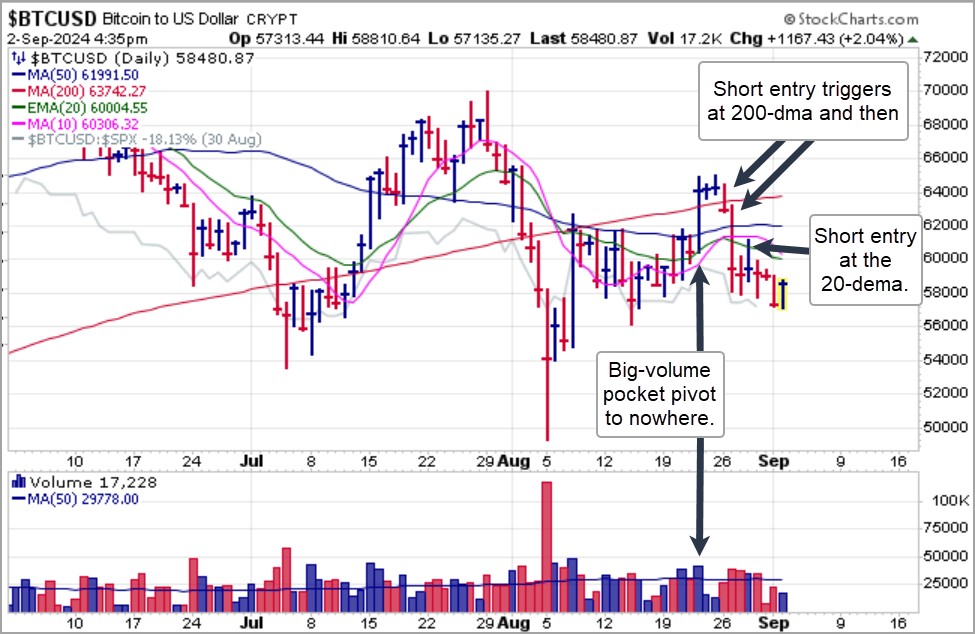
Bitcoin ($BTCUSD) looked quite strong the prior week as it posted a big-volume pocket pivot through the 50-dma and 200-dma. That ended very quickly and very badly as $BTCUSD first triggered a short entry as it reversed back below the 200-dma and followed that up very quickly with a short entry trigger at the 50-dma on the same day. That was followed by a short-sale entry at the 20-dema into a reaction bounce. $BTCUSD is now in a short bear flag and appears set for lower lows.
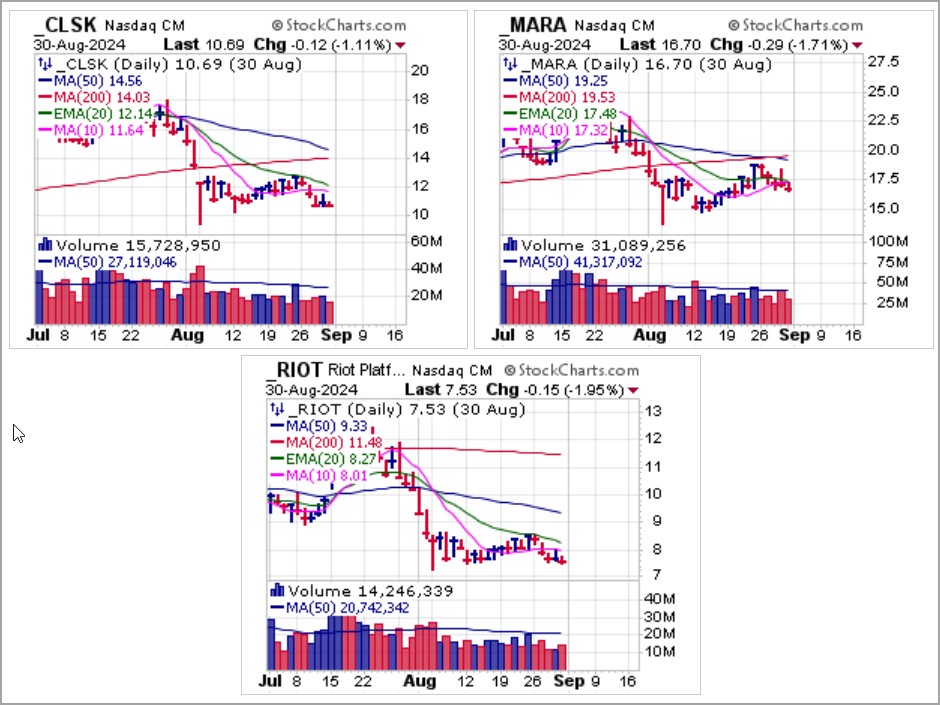
 Crypto-stocks were hammered as a result of $BTCUSD's failure at the 200-dma, and pocket pivots posted two Fridays ago by CleanSpark (CLSK), Marathon Digital Holdings (MARA), and Riot Platforms (RIOT) went nowhere as the group trended lower all week right along with $BTCUSD.
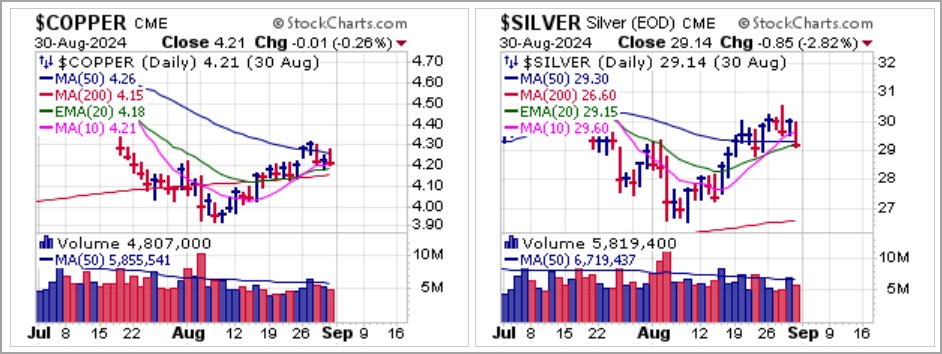
 While silver acts more like an industrial metal, it currently correlates more closely to copper. Note that while copper has been in a long downtrend since peaking in April, on a very short-term two-month basis we can see that the daily charts of copper and silver futures appear to be moving in lock-step.
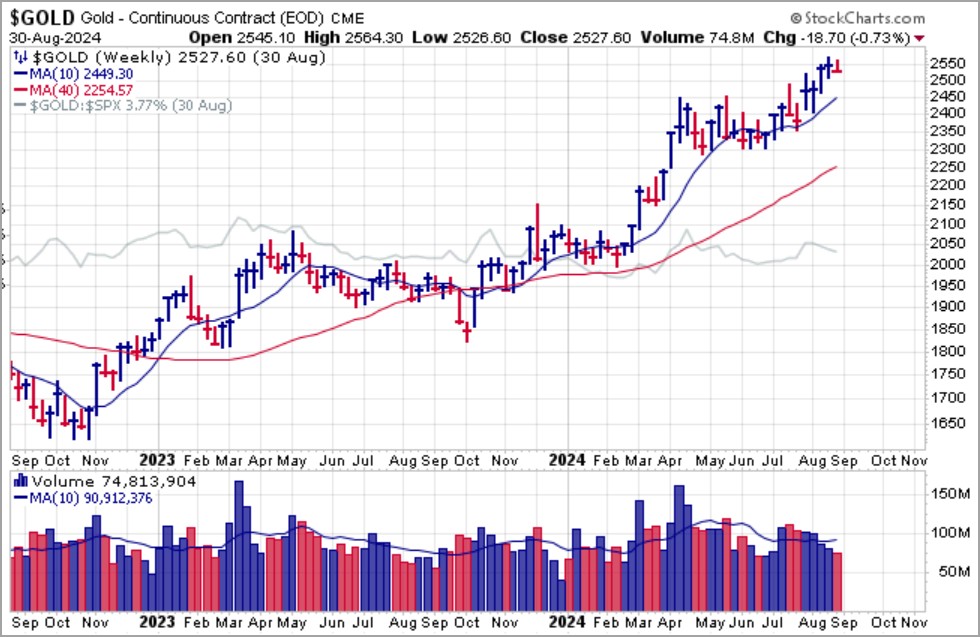
 What we certainly know about silver is that at the present time it is not gold. Gold, primarily a monetary asset, posted another all-time monthly closing high in August and remains near its all-time highs. Gold futures sold off less than 1% on Friday, so while many point to a "crowded" long gold trade, the crowd appears to be quite stubborn. However, it is important to consider that gold's monetary is taking on much greater significance as central banks around the globe continue to add the yellow metal to their reserves.
This has resulted in gold now being the #2 reserve asset among CBs around the globe at 16.6% vs. the #3 asset, the Euro, at 15.9%. Gold is also 2024's top-performing asset when measured against the NASDAQ and S&P 500 Indexes, crypto, and bonds.
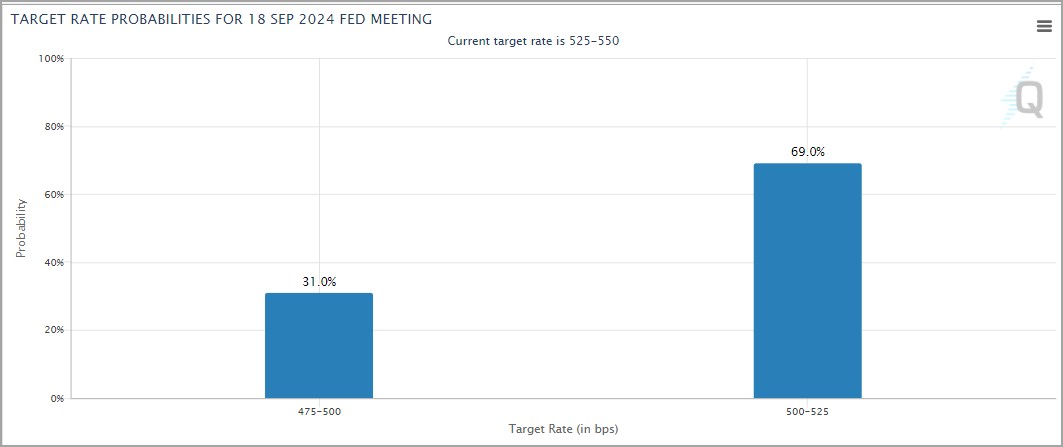
Currently, market participants assign a higher probability (69.0%) of a quarter-point (0.25%)rate cut from the Fed when it meets in mid-September vs. a half-point (0.50%) rate cut.
Meanwhile, interest rates, as measured by the 10-Year Treasury Yield ($TNX) and the U.S. Dollar ($USD) both rallied on Friday. One might argue that a quarter-point Fed rate cut is more than priced into the market, which acts more like we are rapidly heading back to the zero-bound, something that is not likely under any type of soft landing scenario which is now starting to dominate the current Goldilocks narrative of Fed rate cuts with no recession. We would not assume anything in this regard as generally what the crowd expects is often what is not delivered.

The current market rally has been primarily an index phenomenon as the situation underneath the surface with respect to individual stocks remains murky and mostly undeveloped. Should we see any compelling long situations we will issue reports as necessary. But for now, playing the market primarily as an index phenomenon has been effective, which is why the Market Direction Model (MDM) remains on a BUY signal.
