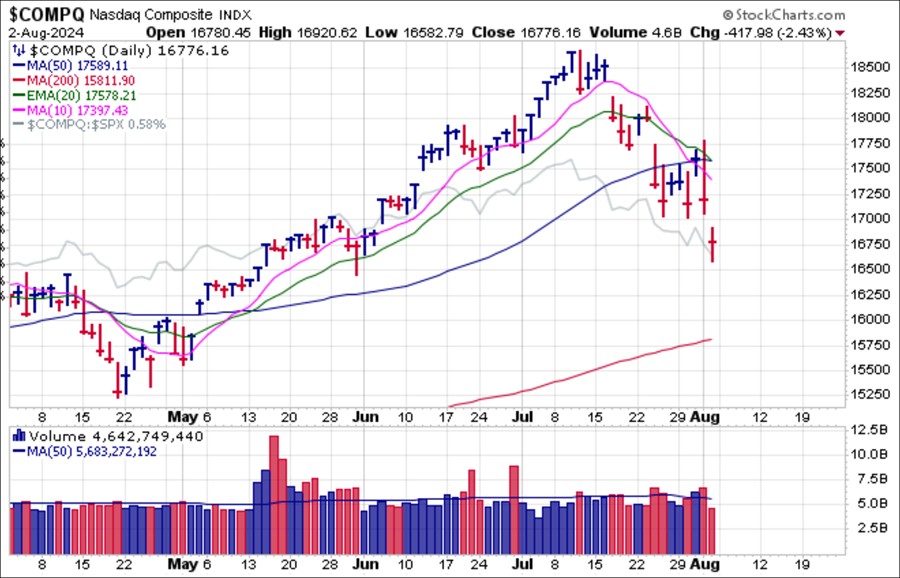

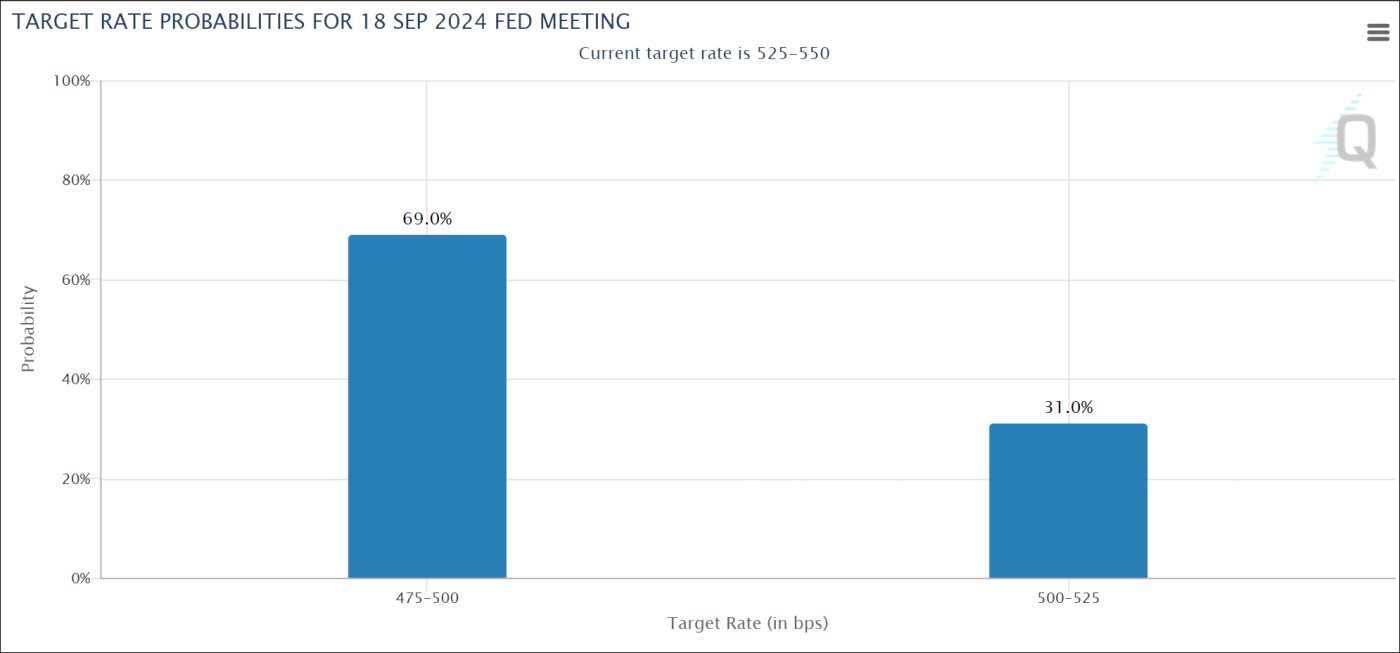
 Meanwhile, Fed Funds Futures are now predicting a 69% chance of a half-percent, or 50 basis point, rate cut from the Fed at its September meeting. Historically, when the Fed starts to lower rates amid a market correction, the selling worsens. So far, the action in stocks this past Friday is consistent with that historical tendency.
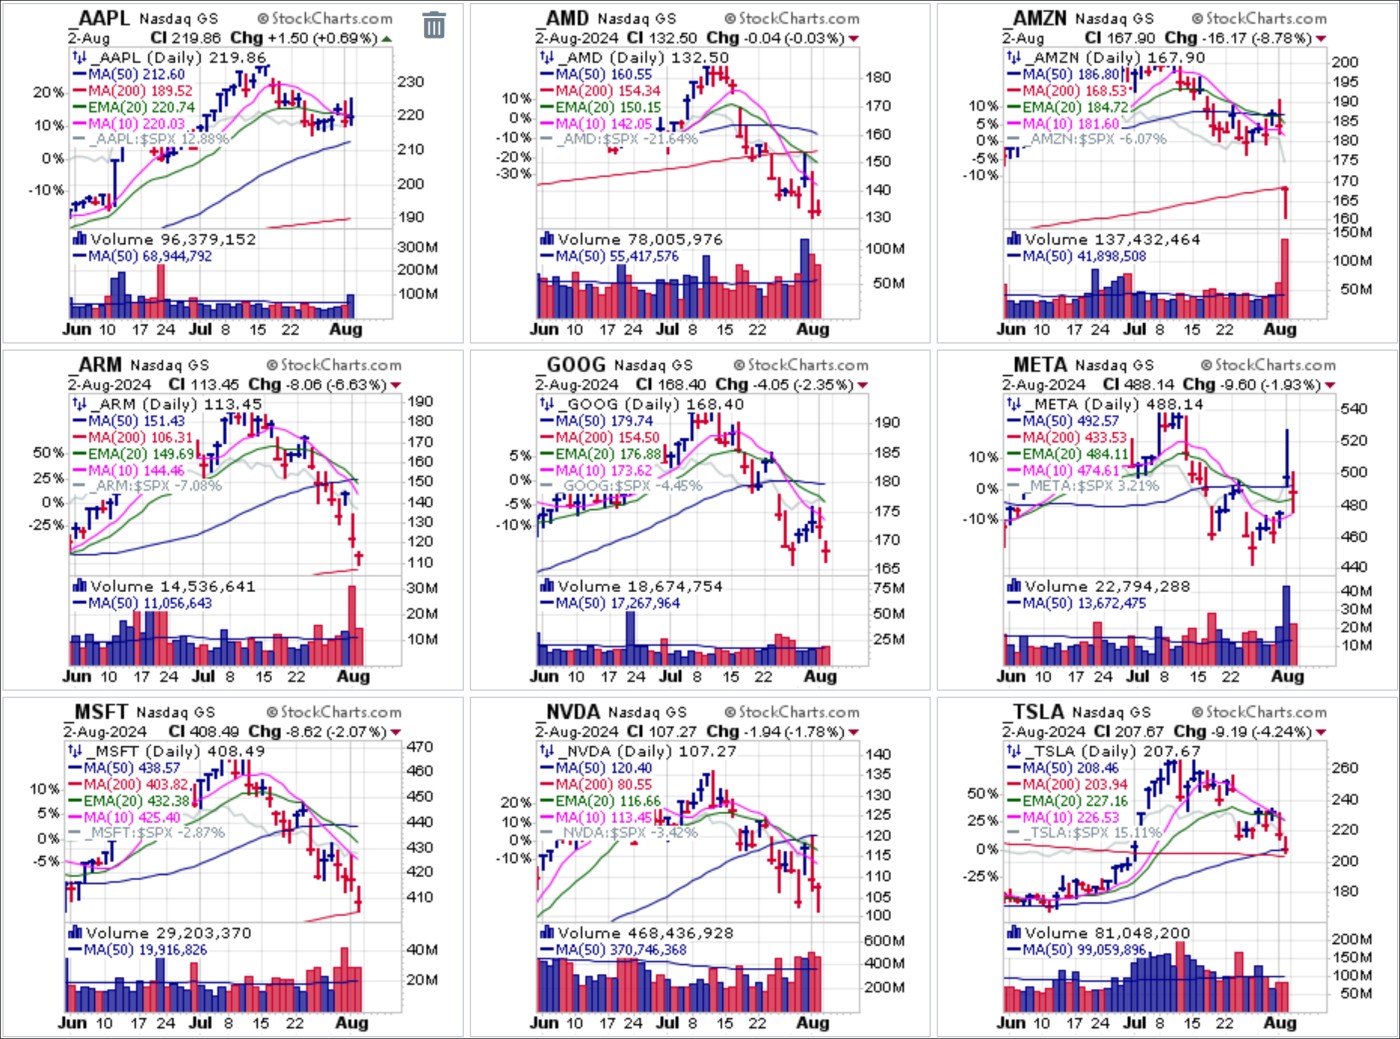
 The broad damage in tech is evident in the charts of most of the biggest tech names, including such stalwarts as Amazon.com (AMZN), Alphabet (GOOGL), and Nvidia (NVDA). Apple (AAPL) was the lone name trading to the upside after reporting earnings on Thursday evening, but the move reversed at the 20-dema on heavy volume, so technically played out as a short-sale entry trigger at the 20-dema which is then used as a covering guide.
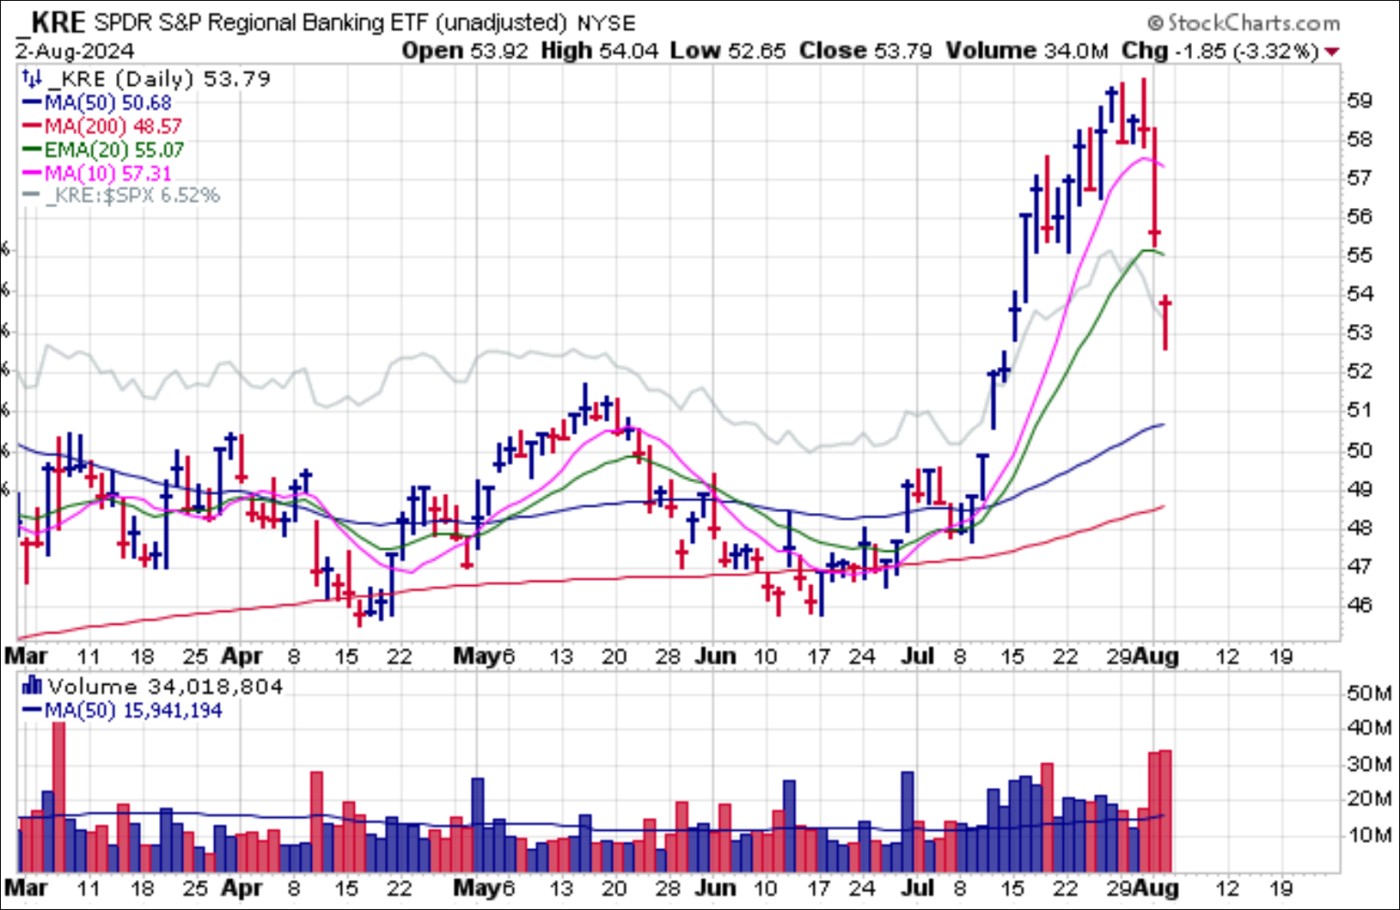
 Regional banks, which had puzzlingly rallied impetuously over the prior three weeks suddenly had the rug pulled out on Thursday as illustrated by the SPDR S&P Regional Banking ETF (KRE). The reasons for the sharp upside in the space were unclear, and money has come out of the group even faster than it went in as the market sell-off broadened into week's end.
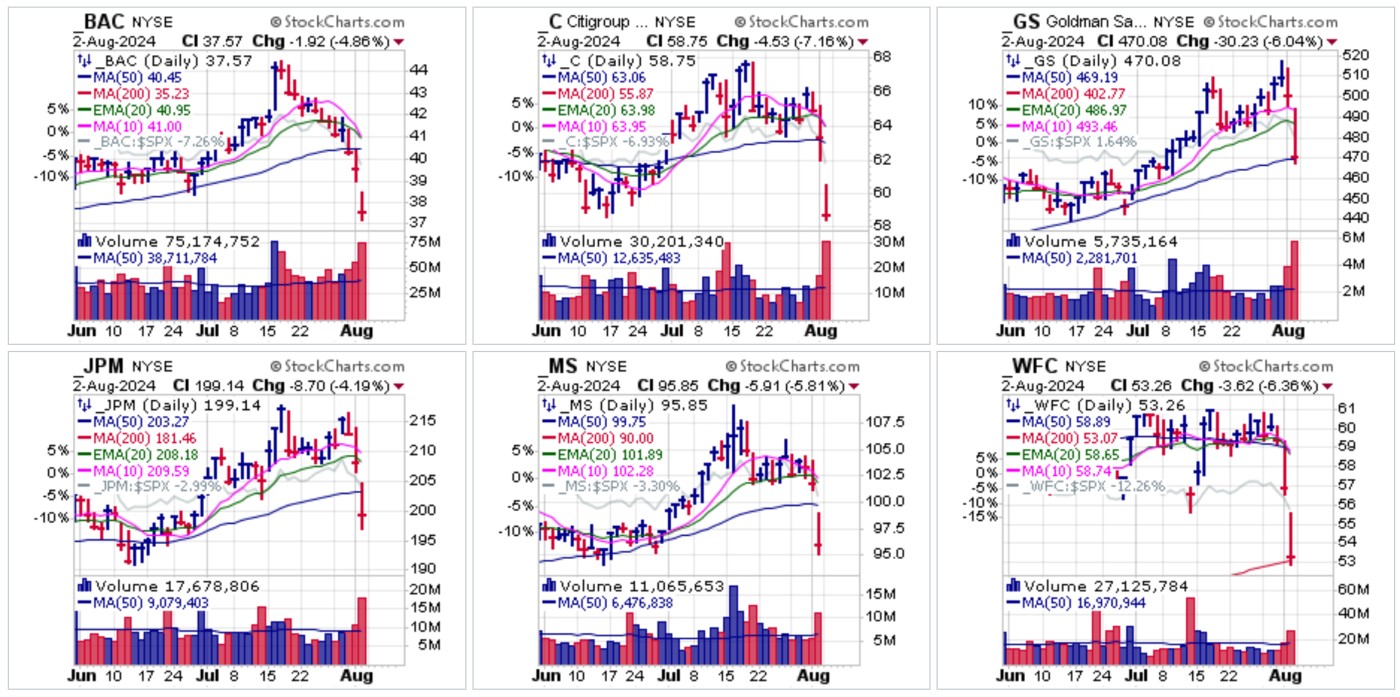
 We also saw sharp and brutal breakdowns in big-stock financials, most of which had started to roll over earlier in the week before gathering downside momentum on Friday in big gap-down moves that ranged from -4.19% on the low end to -7.16% on the high end as was seen in Citigroup (C). Bank of America (BAC) has been sliding for the past three weeks as news that Warren Buffett has been unloading Berkshire Hathaway's (BRKA) position in the big-stock bank raises fears that something nasty is bubbling underneath the surface of BAC's business.
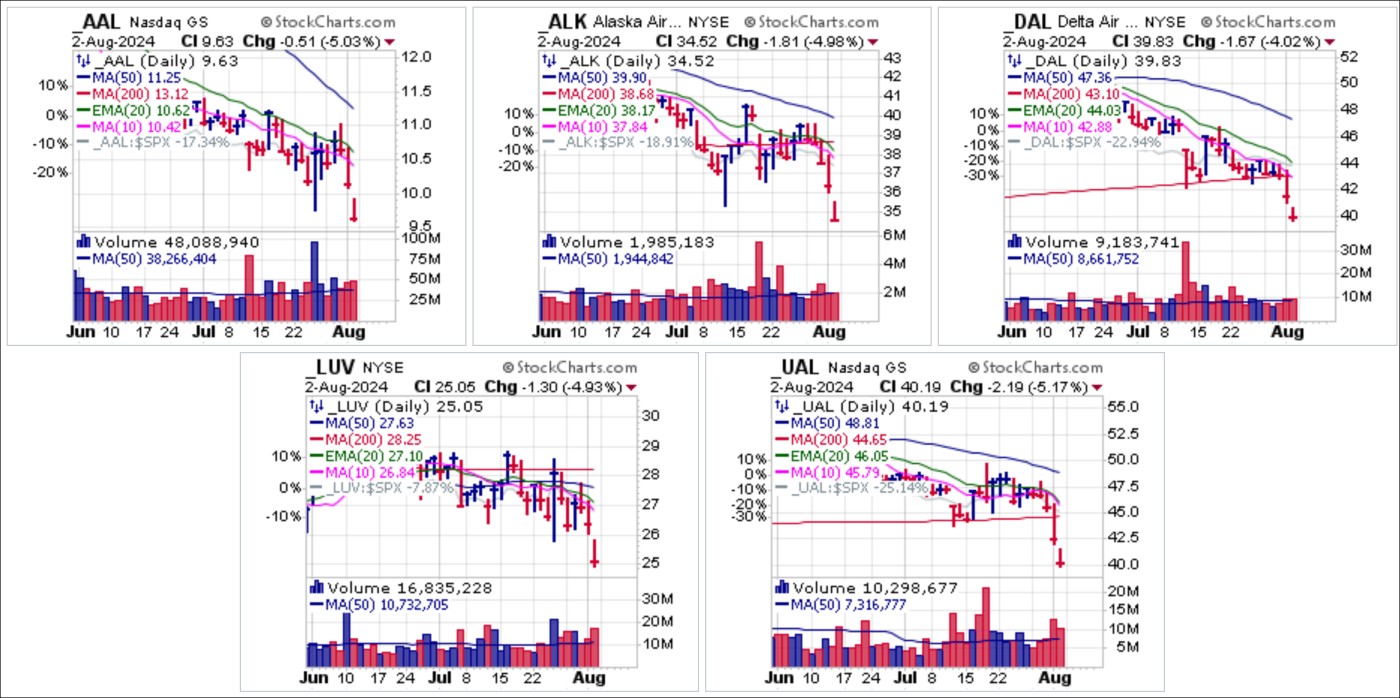
 Airlines were also decimated across the board this past week as a rapidly slowing economy will no doubt have its effect on the travel industry.
 Signs of a consumer that is in trouble were already evident among the big-stock automakers Ford (F) and General Motors (GM) well over a week ago. While Friday's market break was one of the largest we have seen over the past couple of years, it was not hard to see coming as stocks across the board have been weakening for at least the past two weeks.
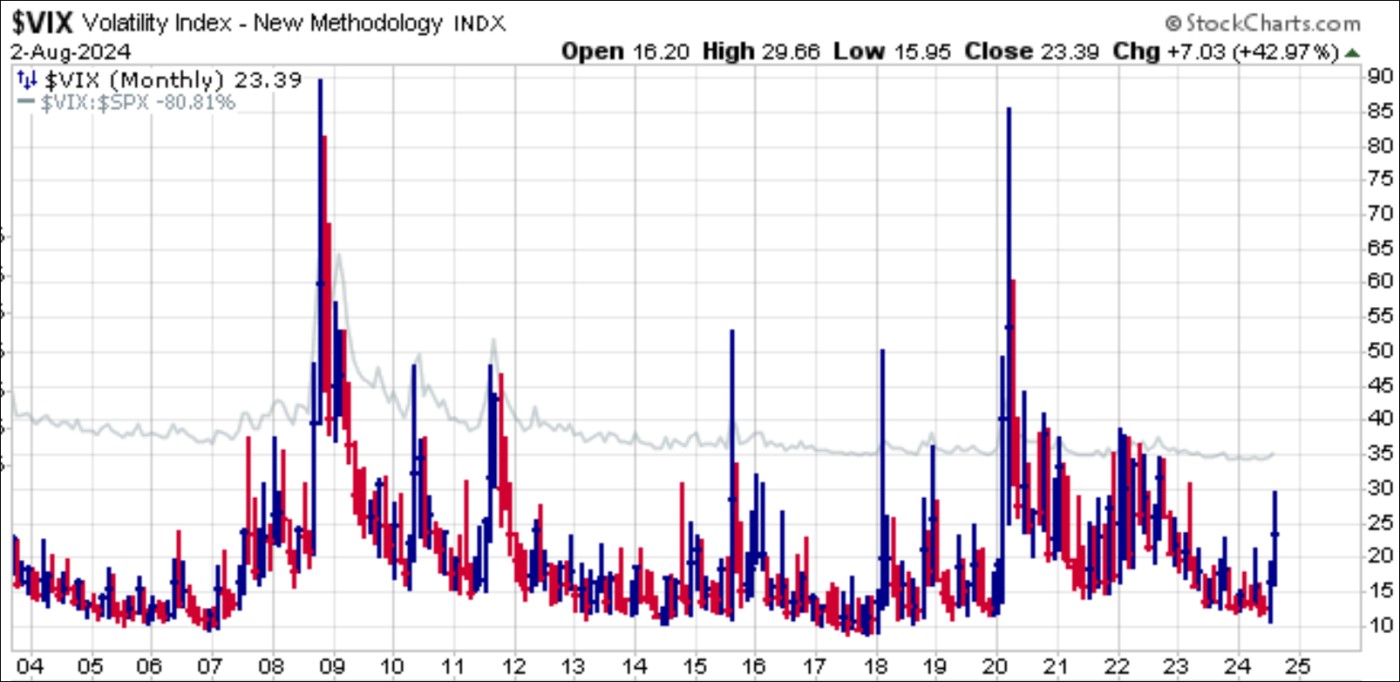
 As the market sell-off became obvious on Friday to the slow animals in the herd, fear once again came into play as the CBOE Volatility Index (CBOE) spiked to an intraday peak of 29.66 before settling back to close at a still elevated 23.39. Whether this indicates a near-term reaction low for the market is unknown, as the sell-off could carry for several more days even as fear begins to spike.
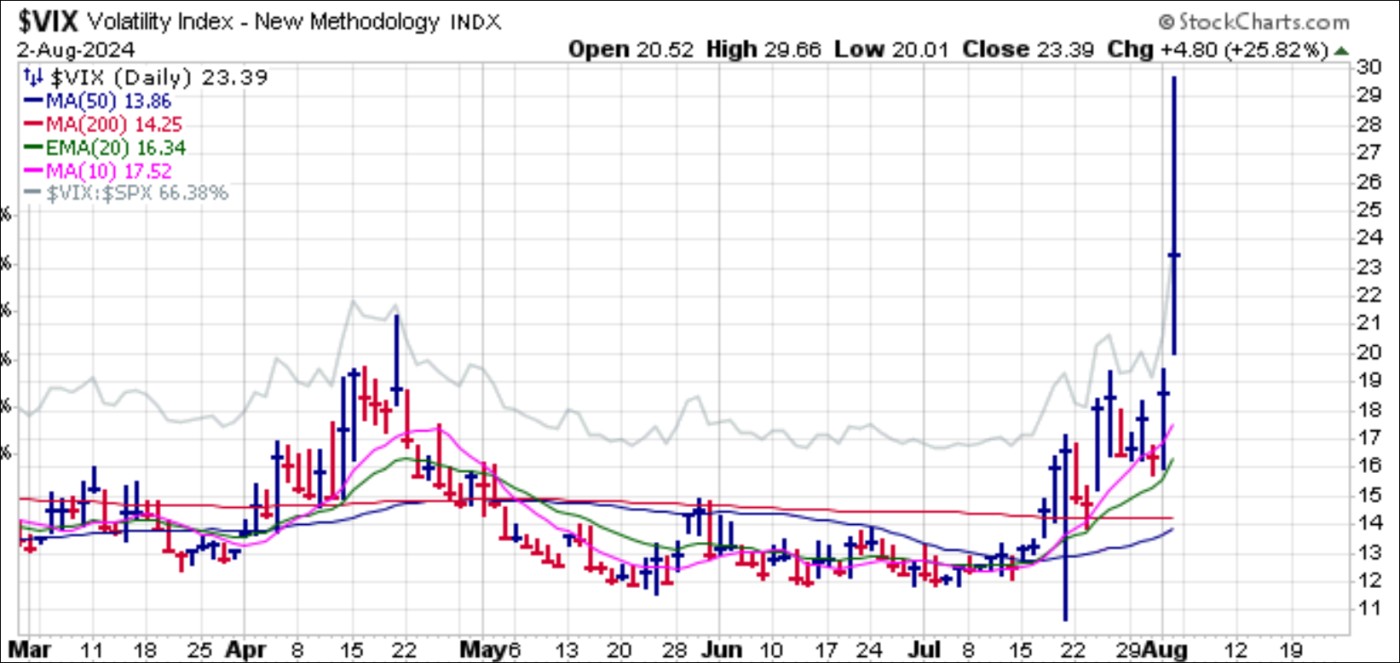 Within a longer-term context on the monthly chart, the $VIX's move on Friday was nothing compared to prior upside spikes over the past 20 years, even the lesser ones, which may imply that more upside in the $VIX is possible. Therefore, we would not necessarily assume that a firm low is in place for the markets based on the $VIX alone.
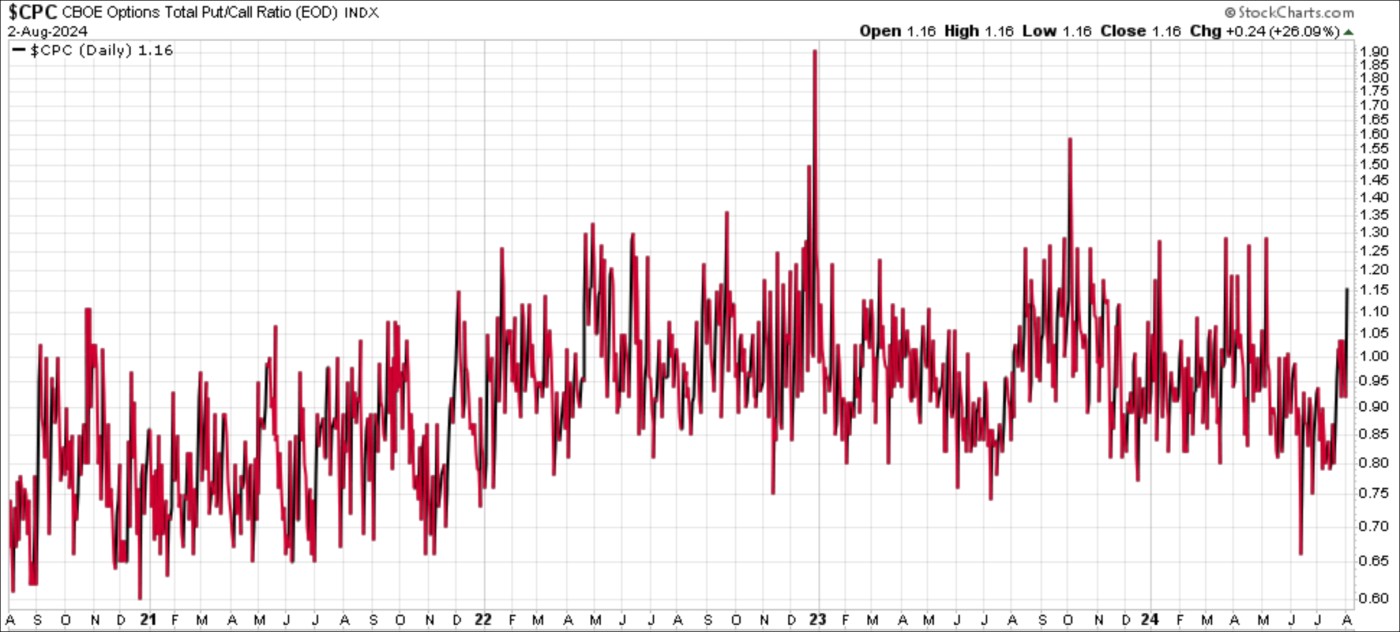
 A pike in the Put/Call Ratio has pushed it up to levels approaching that seen in prior market sell-offs over the past four years. As Friday's sharp sell-off has made the downside which began 2-3 weeks ago more obvious to the crowd, it may not necessarily indicate a firm low is at hand. Caution is advised since many chart patterns are quite busted at this point and, at the very least, in need of a period of healing.
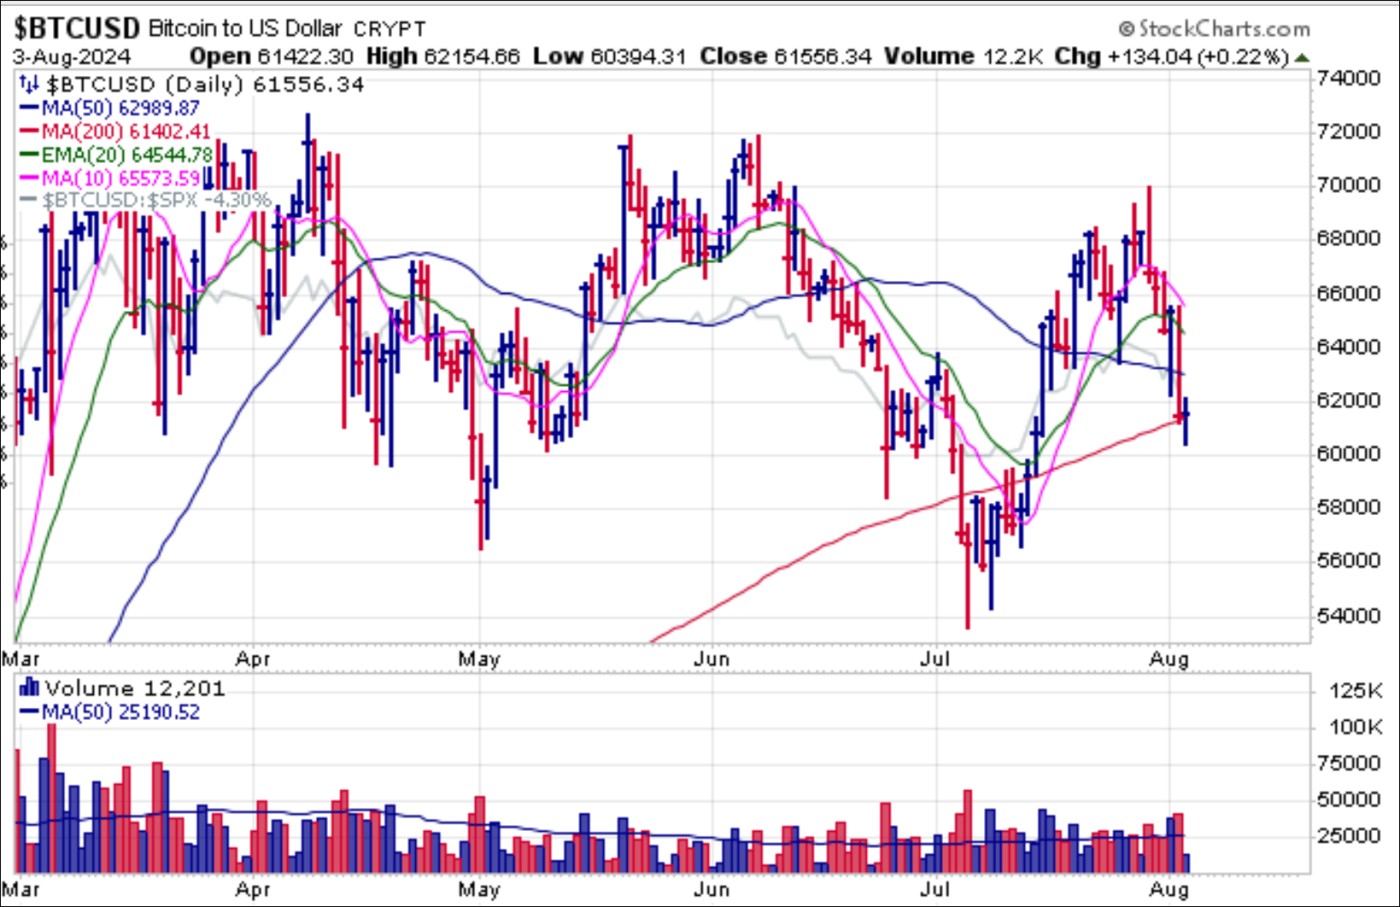
 Bitcoin ($BTCUSD) was thrashed on Friday as it careened back below its 50-day moving average before holding 200-dma support on heavy selling volume. That triggered short-sale entries as it reversed below the 20-dema early in the day and then later on as it slashed through 50-dma support. Over the weekend it is clinging to 200-dma support but for now $BTCUSD is under distress and is technically a short-sale as it has broken 20-dema and 50-dma support and may soon find itself closing below the 200-dma.
The recent drop was caused by several factors, starting with weak earnings from Google on July 24, followed by Microsoft's disappointing results on July 30. Despite these setbacks, overall earnings so far have been better than expected, as seen in previous quarters. Additionally, a disappointing jobs report caused another market gap down on Friday. Preliminary reports indicated that the unemployment rate increased by 0.2%, partly due to temporary layoffs from Hurricane Beryl, which significantly affected payroll gains. The number of people out of work due to bad weather reached 461,000, the highest for July on record. The BLS downplayed this, but the New York Times noted that nearly half a million people reported being employed but not working due to bad weather, the highest since January.
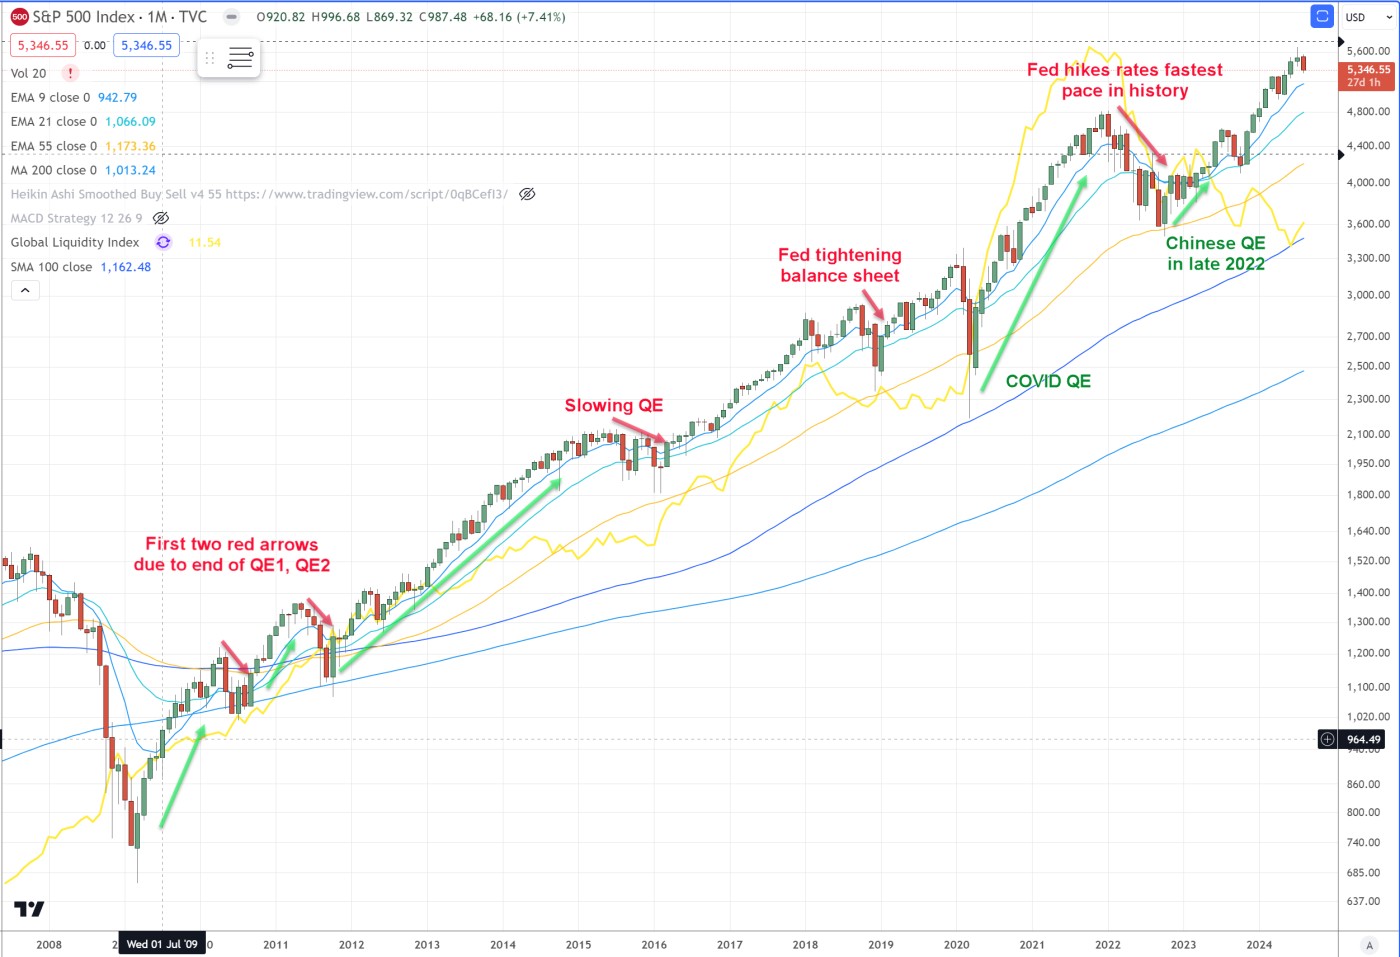
In early 2018, when the economy was slowing, major averages experienced sharp pullbacks like we are seeing now, but eventually reached new highs despite shrinking QE. To minimize such whipsaws, the model made an adjustment in 2019 to hold positions longer to minimize whipsaws while profiting from a larger portion of an uptrend in this Era of QE.
Sharper pullbacks have been rare. In each case, the model was typically either in cash or on a sell signal such as in 2020 where it had sharp gains from the COVID crash and in 2022 during most of the bear market. These deeper selloffs have been a result of: 1) late 2018 due to balance sheet tightening, 2) early 2020 due to COVID-19 (mitigated by QE), and 3) 2022 due to rate hikes (reduced QE). Since QE began in late 2008, traditional recessions have been avoided or postponed by the Fed's interventions.

Today, major central banks are injecting QE into the system to address slowing economies. This should help prop markets as macro tends to guide major averages but that does not mean markets cant fall further. Expect a continuation of heightened volatility.
Note below how the NASDAQ-100 fell in 2022 and from July to October 2023 both times as a result of falling global liquidity (QE, GMI). That said, in 2024, major averages continued to new highs despite the fall in global liquidity due in part to strong earnings, falling inflation, and utility created by big tech companies. "Stealth" QE was also a big factor in propping markets since governments must print to pay for onerous debt interest and unfunded liabilities among other expenses.
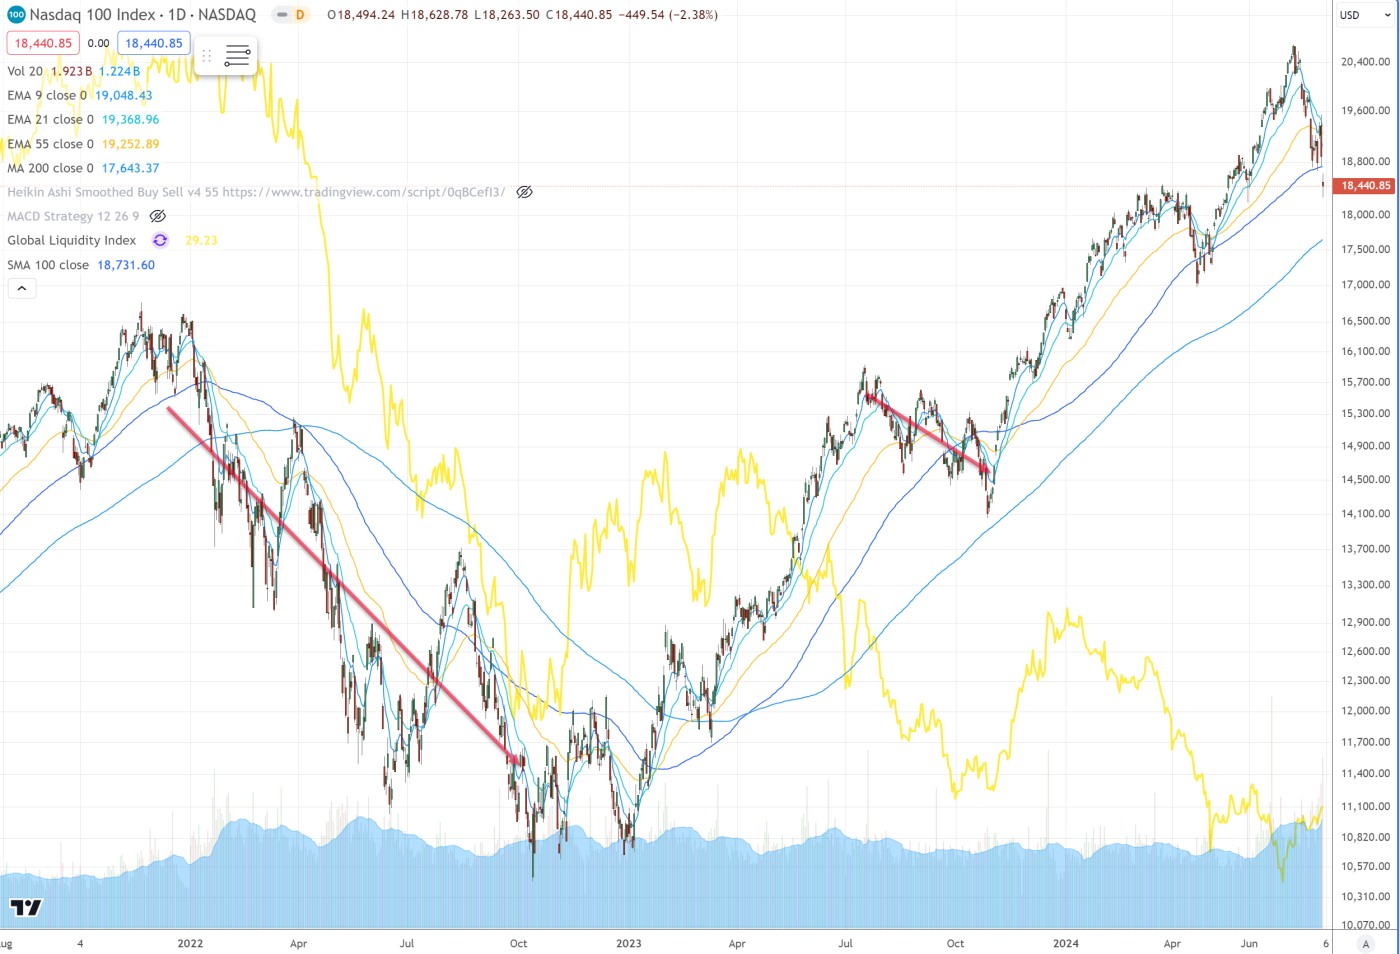
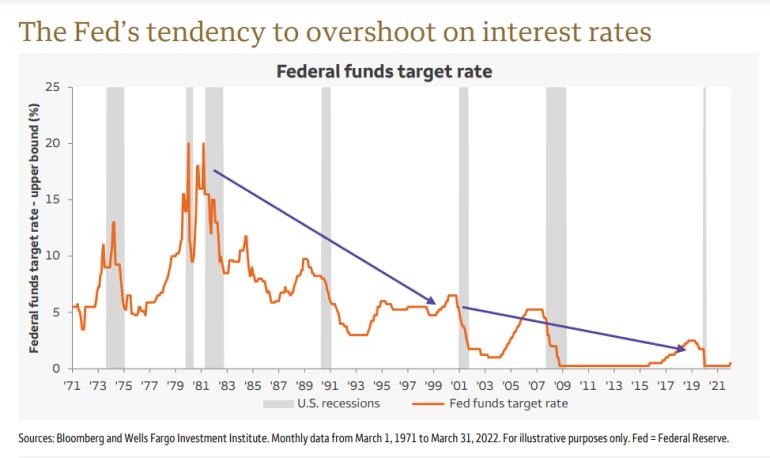
The Fed will add to the liquidity pool or may even justify renewed QE to prevent a traditional bear market based on their prior behavior. This is not to be confused with stealth QE, or what some call the shadow monetary base, which is ongoing. They certainly now have room to lower rates.
At the start of prior rate reductions, markets often did not enter recession for some months if we look at the fed funds rate. In 2007, the Fed started lowering rates in August but the stock market did not top until November. Recession then started in December. In 2001, rate cuts started in March but the market had already topped in March of 2000. There have been no standard recessions since QE was launched in 2008.
It was only recently that major averages were facing overbought conditions such as the S&P 500 hitting new highs on July 16. But disappointing earnings news out of majors such as GOOGL and MSFT together with a weak jobs report have pushed markets down hard. Exacerbating the selling has been the margin call induced forced selling. This often creates "V" bottoms in major averages along with a spiking VIX and put/call ratio, but that does not mean the market cant go lower in the interim. Expect a continuation of heightened volatility in both directions.
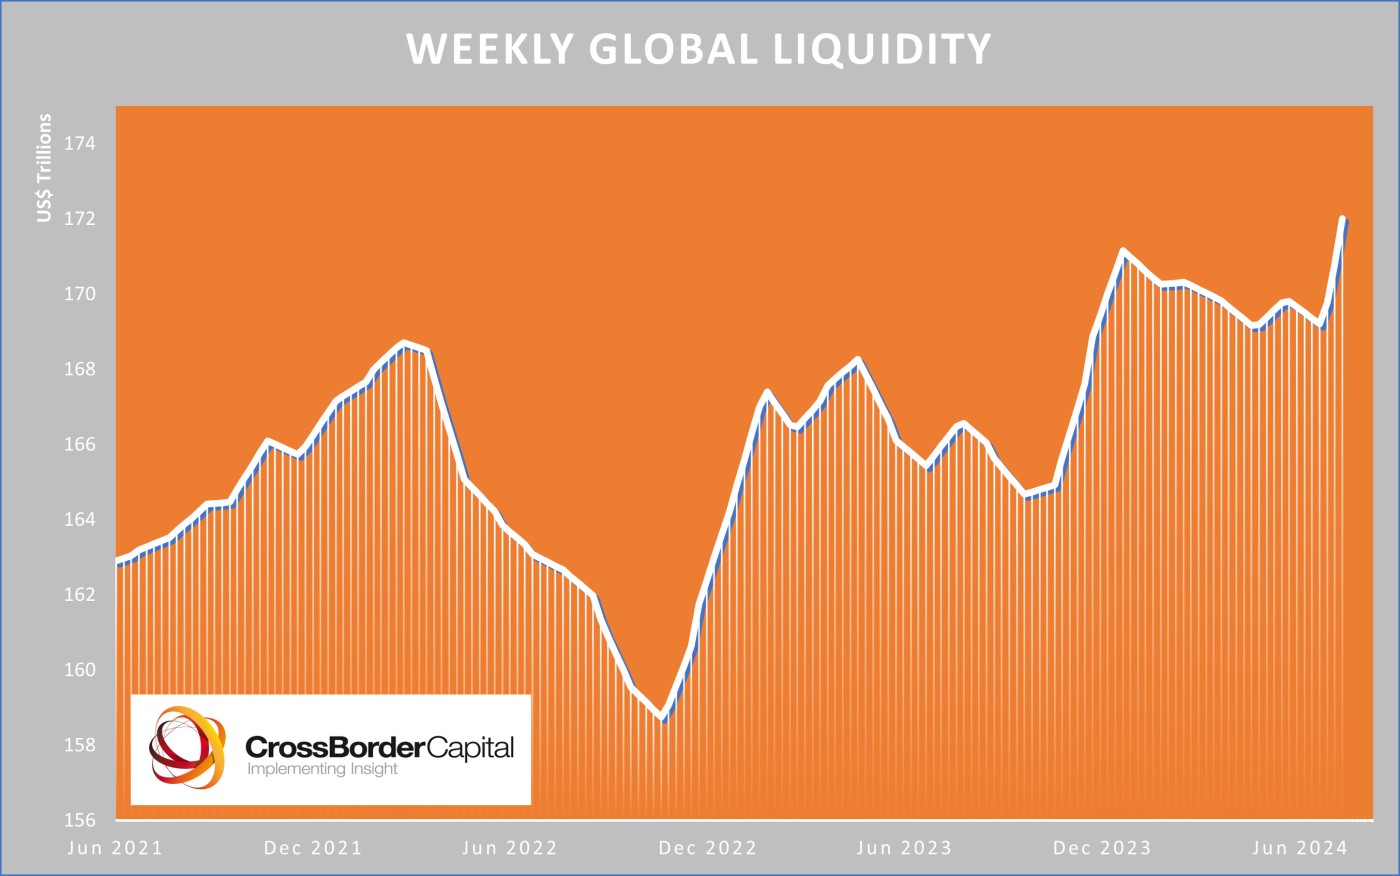
As a consequence of the slowing global economy, global liquidity is on a recent sharp rise especially when accounting for private sector liquidity which includes all flows of cash and credit as well as major central banks as shown in the chart below. Chinese QE starting in late 2022 was the major catalyst as to why markets rallied sharply in early 2023.
If we take a bird's eye view using a monthly chart of the S&P 500, QE/GMI liquidity drives markets:
