Market Lab Report
by Dr. Chris Kacher
The Web3 Evolution Will Not Be Centralized™
Healthy labor market?
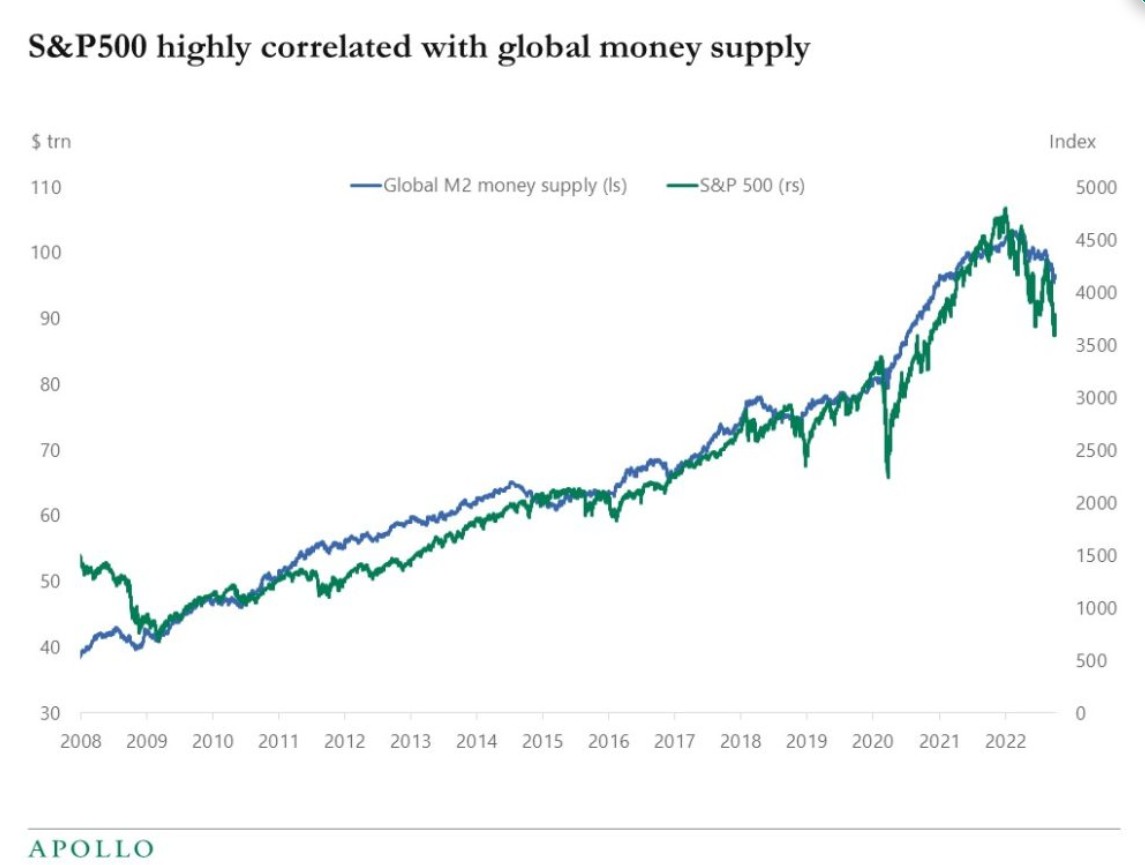
According to the Bureau of Labor Statistics, the number of job openings in April returned to the pre-pandemic norm of about 1.2 per person. This gives the Fed room to lower rates due to a labor market that is less tight than when it stood at 2 per person. But it has been argued that the data far overshoot the health of the labor market. According to Bloomberg's chief economist, “Several Fed officials seem to believe the labor market is still tight, but we estimate, based on more comprehensive measures, that monthly nonfarm payrolls prints likely overstated job growth by 730k last year — with hiring maybe even falling below zero in October.” She estimates the true pace of job growth is below 100,000 a month, well below the official 242,000 figure. This suggests the BLS will have overstated employment by more than one million by the end of 2024. Nevertheless, the market trades on the official data thus believes in the skewed inflation data. Meanwhile, the main factor driving markets since 2008 has been QE in all its forms as the correlation between the S&P 500 and QE is strong.
Recession when?
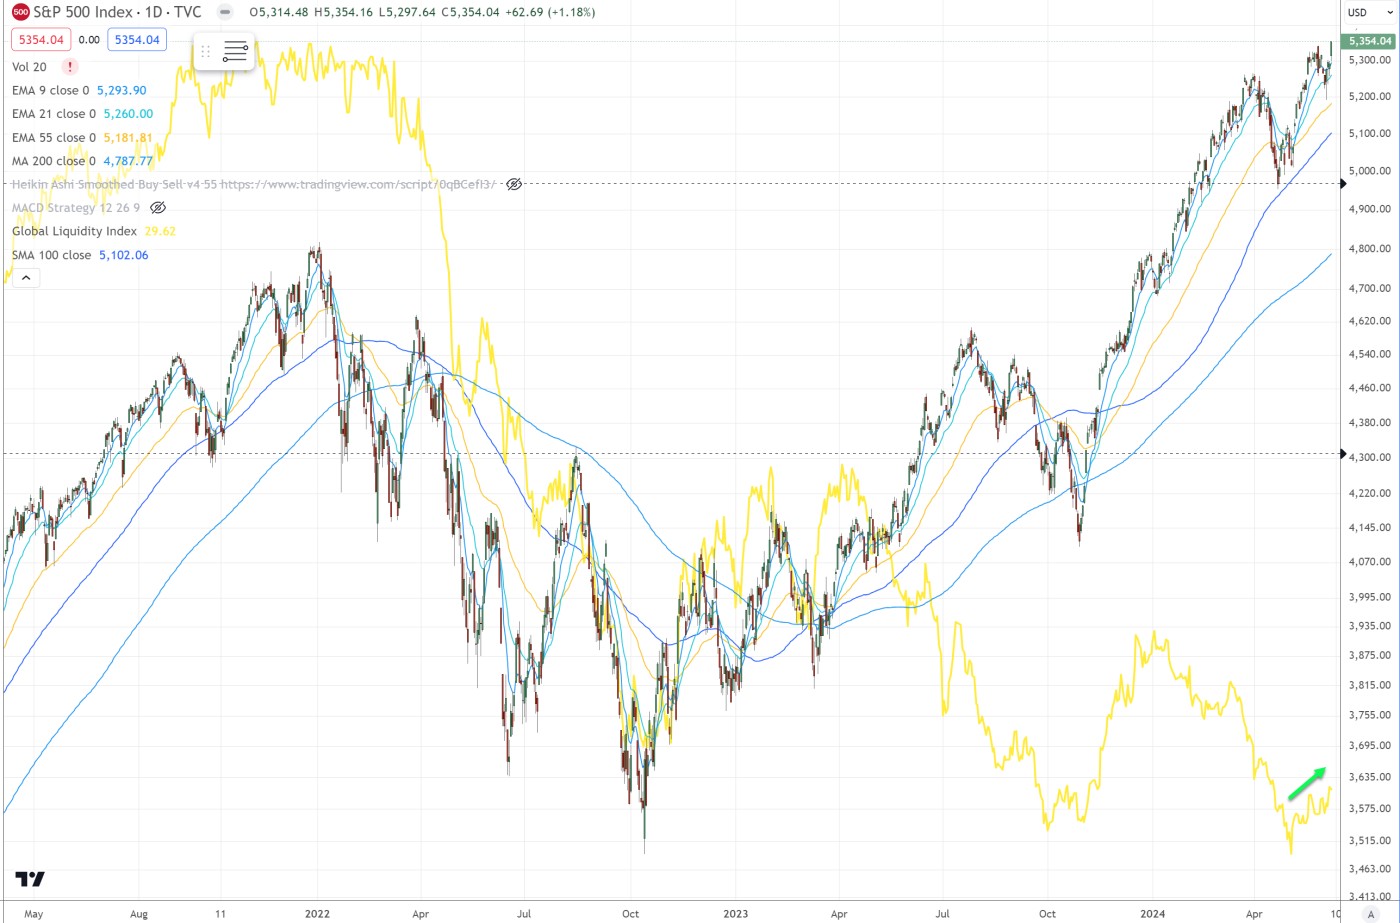
As for inflation, the core PCE came in at 0.2% below 0.3% estimates. This helped markets quickly find their floor on Friday. Yields on long bond Treasuries and the dollar weakened. Global liquidity started to move higher since Powell announced a dovish taper of the taper which started June 1 as the yellow line shows in the chart below. The central bank said it would scale back the pace of QT allowing only $25 billion in Treasury bonds to run off each month versus the current $60 billion. In addition, corporate earnings overall came in strong with bullish projections going forward.
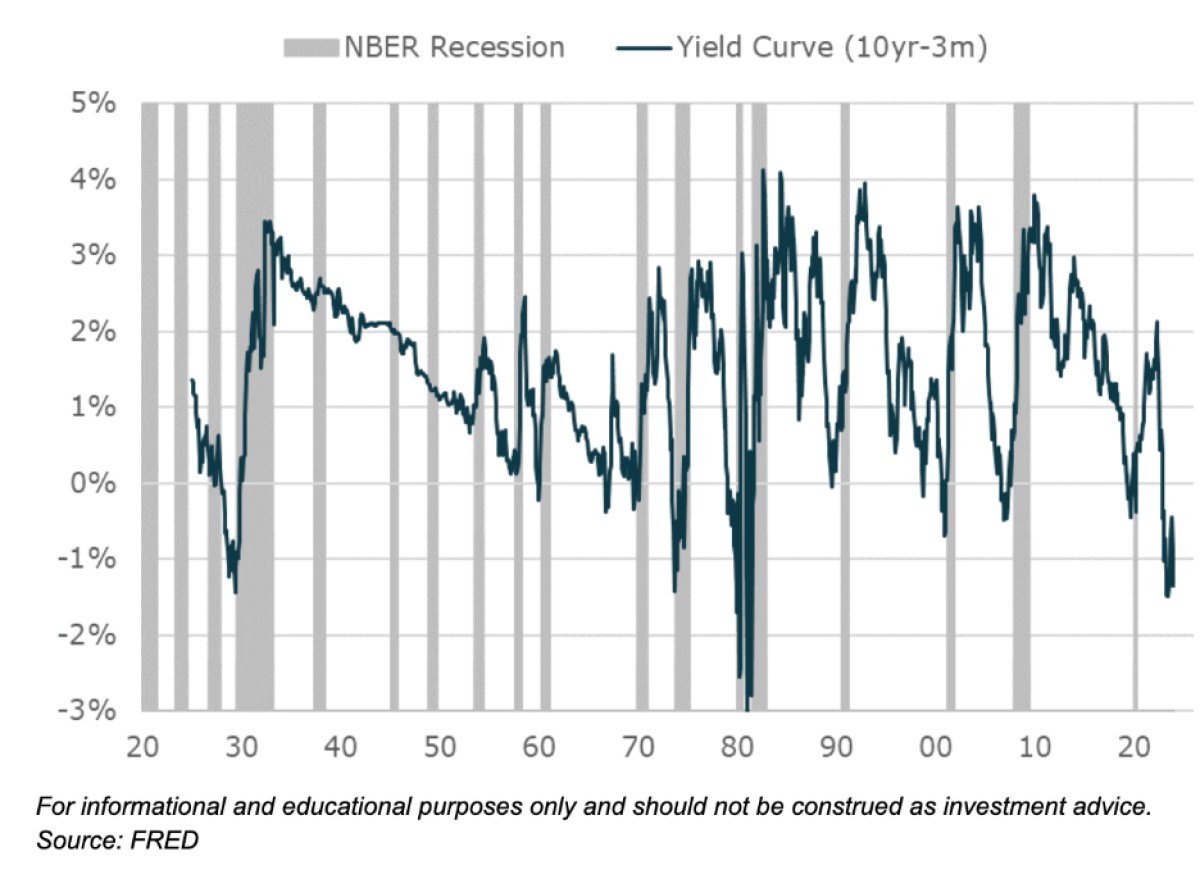
Another bullish indicator is the $6 trillion sitting on the sidelines in money market funds that can be used to buy stocks and bonds. But since October 2022 when the yield curve inverted, many have called for recession. That said, some forget that since the 1960s, stocks actually stayed bullish in two of the six times yields inverted.
Some have suggested the S&P 500 is near a top because of a 90-year chart where it never broke above the upper trendline. But this testing of the upper trendline has only occurred 3 times so not exactly statistically significant. Further, this time is unique adding to the probability that the S&P 500 does not have to adhere to history as recession may get postponed even further as the can gets kicked down the seemingly endless road due to QE in all its forms.
Why this time is different
First, this time is unique because QE which was created in late 2008 has been used to address all black swans and potentially to stave off recession via stealth QE.
Second, we had a record increase in interest rates which brought on the black swan banking collapse in March 2023 which the Fed addressed by injecting emergency QE into the system. This suggests that future black swans will be dealt with in a similar way. Expect more black swans than history would suggest since the system has become less stable than in prior cycles. This will necessitate QE.
Third, record levels of debt, unfunded liabilities, uneconomic global warming laws, and the war effort among other costs keep the QE morphine drip running via stealth QE. This ensures fiat will sink faster thus inflation will accelerate again. People's buying power across the world has been compromised, first by COVID which spurred the greatest round of money creation in history, then by the banking disasters in March 2023, and consistently by stealth QE which only increases over time since record levels of debt also increase over time because the principle is never paid down. Every 100 days, about $1 trillion is added onto the national debt in the US. As debt increases, this dollar number will increase.
That said, there is a fourth reason this time is different. I have argued that the massive utility that cutting edge technologies such as AI is creating could create so much productivity that we can grow our way out of this mess which would be a first. Thus Ray Dalio's study of the long term debt cycle going back centuries would show that instead of revolution and global war where the US dollar is replaced by a new sovereign currency, this time is different due to these technologies which, in time, would further decentralize the planet leading to a far more anti-fragile way of life. Such decentralization would be economically beneficial thus for the greater good across all countries which are interconnected.
But if a global war were to begin, the US would have to emerge as the primary victor if the dollar were to stay sovereign. If there are multiple countries that emerge as potential victors, and fiat has been degraded to such an extent due to support of the global war effort, this could set the stage for Bitcoin to become the world's sovereign currency with other major fiat currencies co-existing alongside Bitcoin.
Indeed, as the sinking of fiat continues to accelerate in the coming years due to increasing debt, social unrest due to inflation will increase. So even without a global war, revolt against fiat due to onerous waves of inflation could push Bitcoin into the position as a possible sovereign contender. Predicting the timeline is difficult at best due to countless variables.
Bitcoin vs M1 money supply
Bitcoin correlates highly with money supply. Bitcoin broke out against M1 money supply for the first time since March 2017 when it went historically parabolic. Since the top in late 2017, the Bitcoin/M1 chart has formed a long base. In 2021, Bitcoin made new price highs due to massive QE money printing. In 2024, Bitcoin reached new price highs without QE money printing but instead during a period of tapering. Stealth QE continues to devalue fiat so Bitcoin reached new highs on this basis.
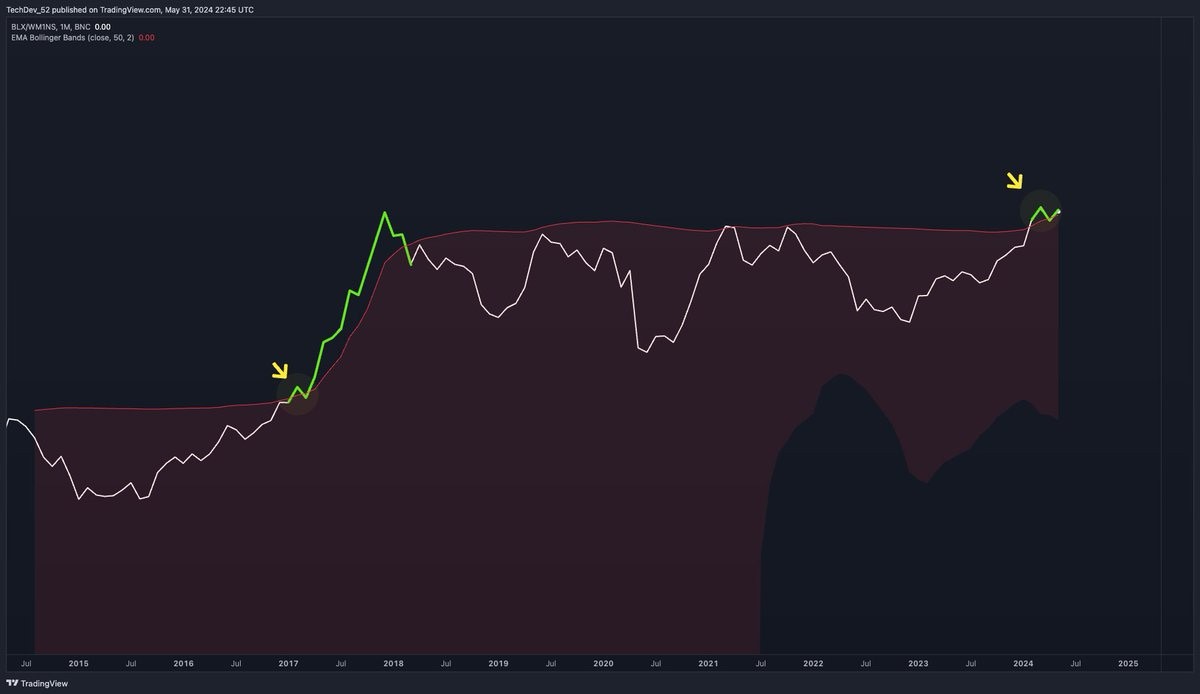
With M1 and M2 set to increase after a period of austerity which began in early 2022, and with the Fed tapering the taper, this could set the stage for a big bull run in Bitcoin.
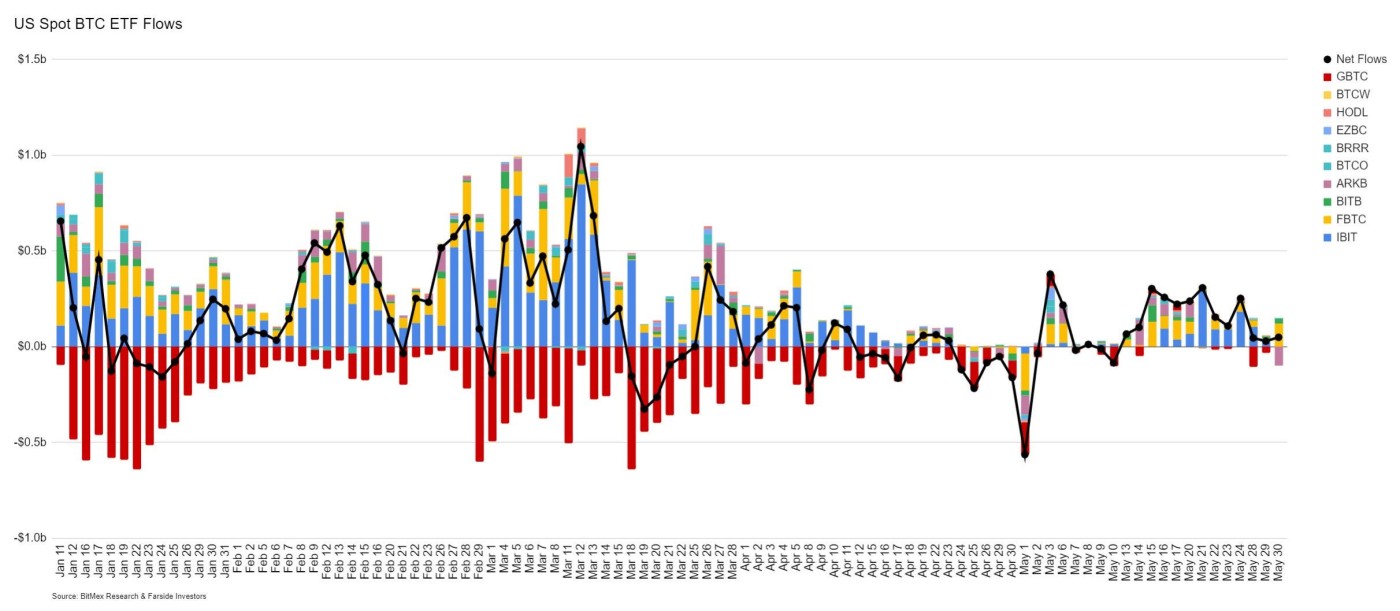
Also, the Bitcoin spot ETFs are slowing winning against any Grayscale GBTC lockup redemptions which I had guessed would eventually trend towards zero. Soon, any future selling of GBTC should correlate more closely with the other major ETFs based on Bitcoin's overall bullish or bearish price action as Bitcoin traces out price/volume patterns in its chart. On Tuesday, net flows was the second highest on record at almost $1 billion (not shown below).