Market Lab Report
by Dr. Chris Kacher
The Web3 Evolution Will Not Be Centralized™
Bitcoin exchange reserves are at an all time low.
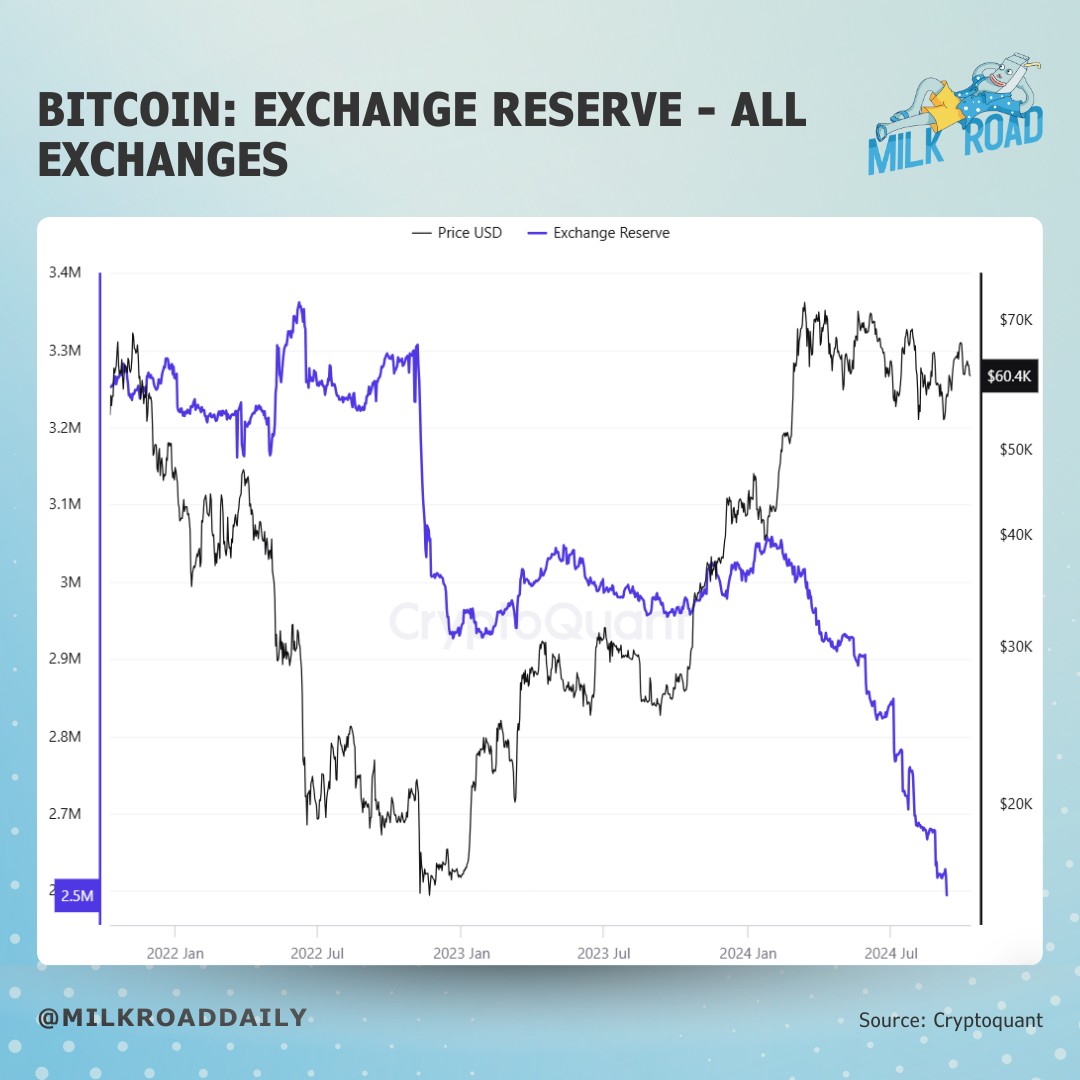
This suggests low supply but demand is still meek. For demand to increase, the following will help:
More QE (the Federal Reserve giving stimmy checks to banks)
Rate cuts (central banks lowering the cost to borrow money)
China’s most aggressive stimulus since COVID (China turning on the money printer)
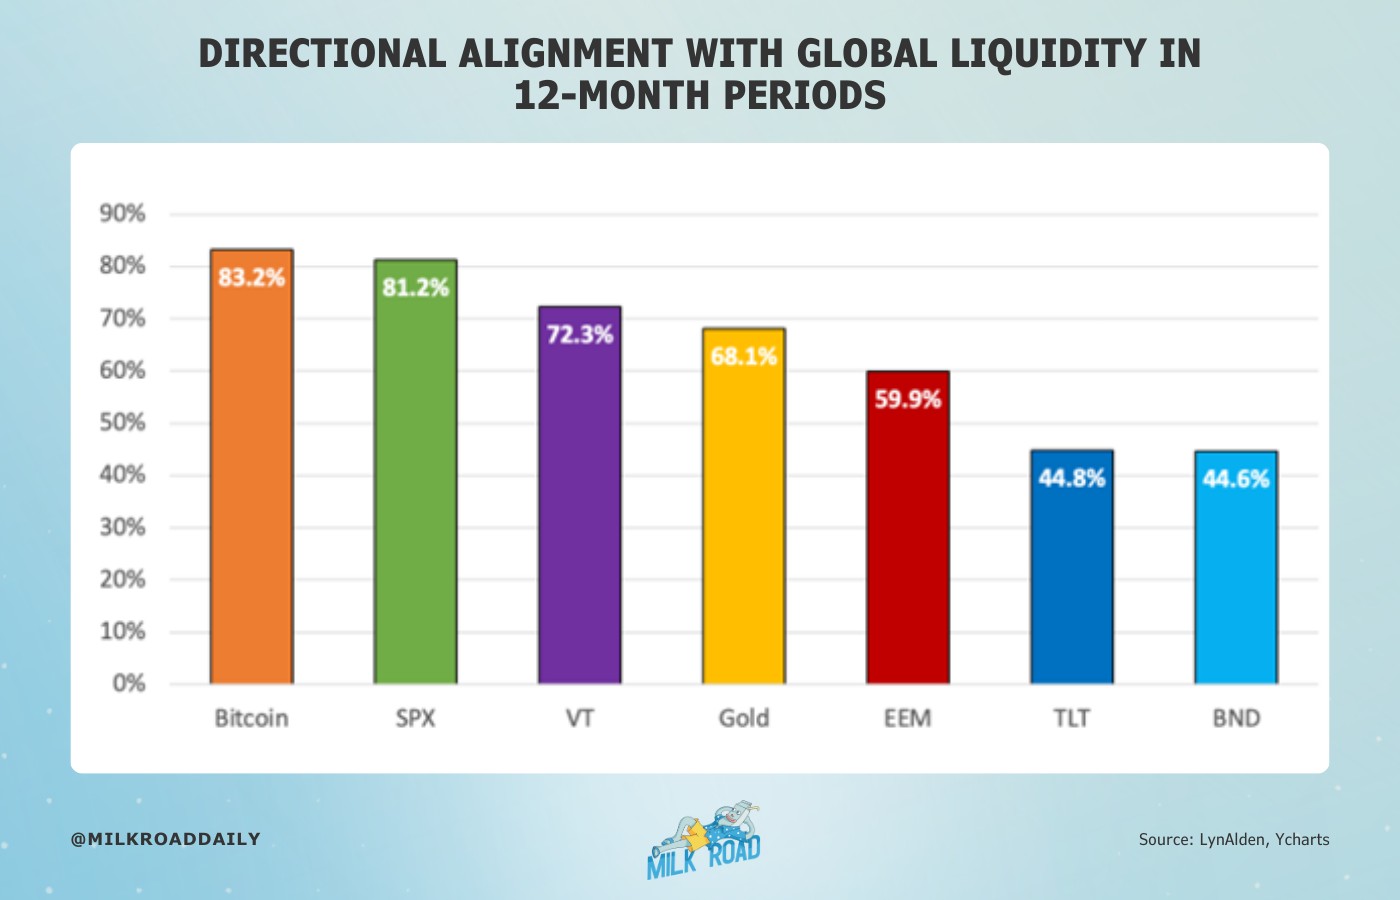
And global liquidity, when including private sector liquidity which includes all flows of cash and credit, has been on the rise. Meanwhile Bitcoin remains stuck in a base due to various factors including it being more sensitive, ie, more risk on, to higher inflation which would imply less liquidity and geopolitical events such as Iran attacking Israel.
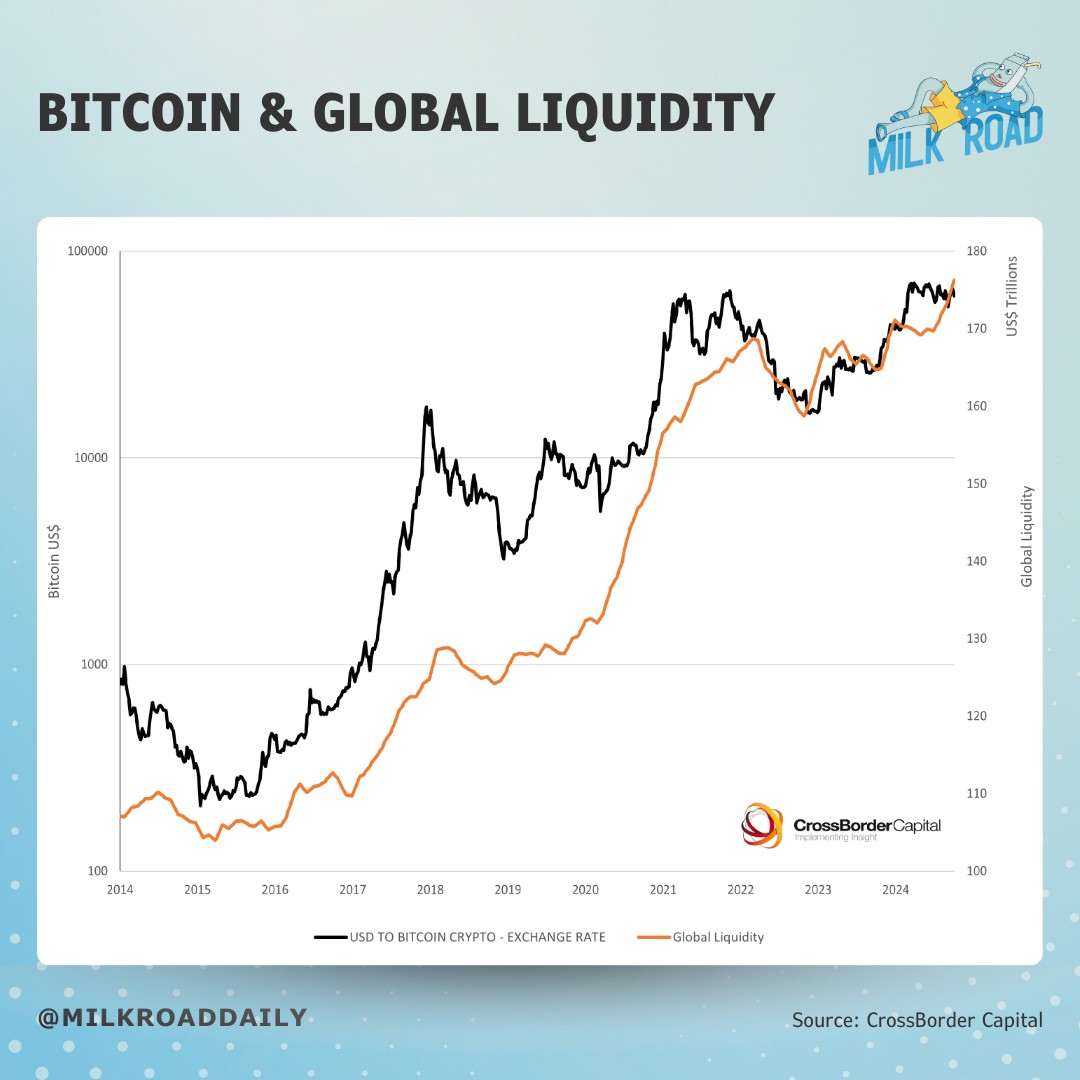
Nevertheless, another bullish event for Bitcoin is that following halving cycles, Bitcoin miners get squeezed as the BTC distribution gets cut in half and exchange rates against USD have not yet been repriced. This causes miners to have to liquidate their bitcoin holdings to cover the temporary gap. As this continues to play out, less competitive miners are forced to drop out of the race which allows more of the Bitcoin reward to be taken by the miners that survive. As these miners start getting the new rewards, their revenue starts to increase, and their need to liquidate from their holdings decreases. This is where the new bottom is formed. Once miners enter a strong position again and begin to re-accumulate holdings, the true impacts of the new supply distribution rate begin have effect on the market. Market price begins to shoot up rapidly as the new reality of lower supply is materialized.
Tidal wave of liquidity
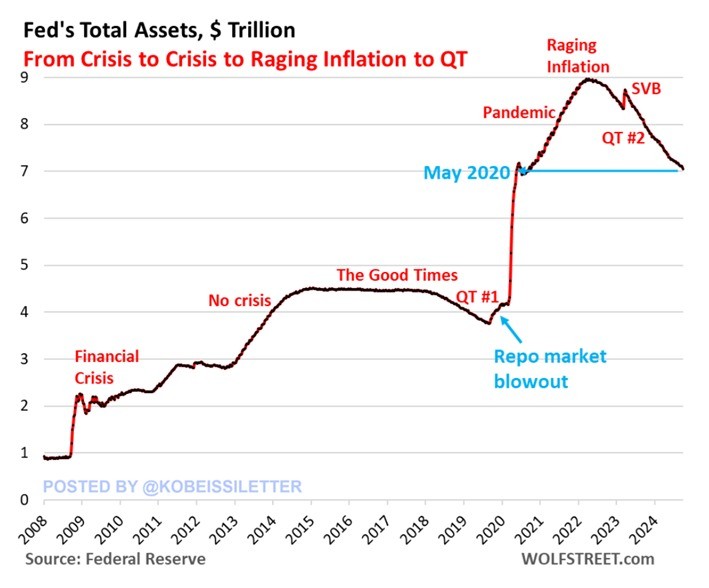
As for liquidity, the Fed has been reducing its balance sheet but doing so by less and less. Now that they have started to lower interest rates, this is the first time they are contracting their balance sheet while doing so. The Federal Reserve’s balance sheet declined to its lowest level since September 2020. This is 40% of the $4.80 trillion the Fed bought during the 2020-2022 pandemic response. At the September Fed meeting, Fed Chair Powell emphasized that balance sheet reductions will continue. Pandemic-era stimulus is taking years to "undo", but these balance sheet reductions are but a small trickle compared to QE in all its forms, stealth and otherwise.
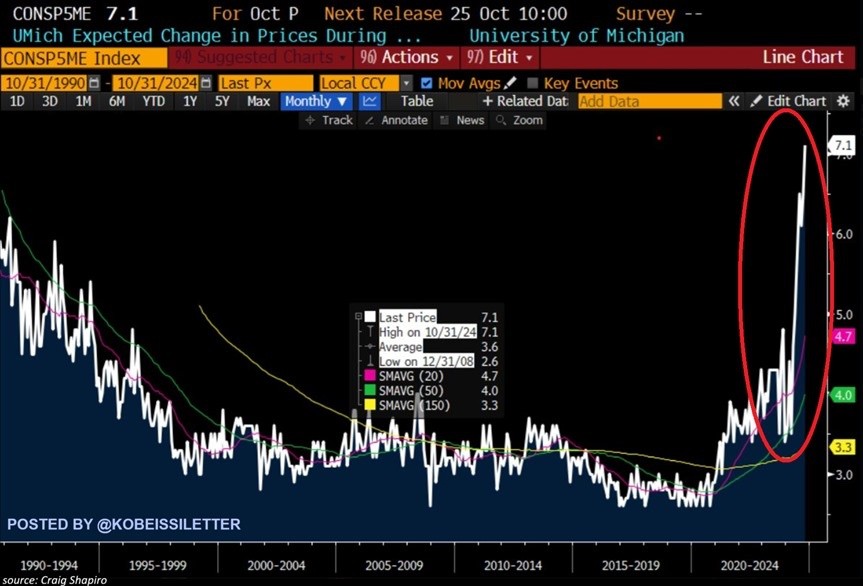
In consequence, US consumers' inflation expectations for the next 5-10 years skyrocketed to 7.1% in October, the highest in over 40 years. This metric has DOUBLED in just several months, according to the University of Michigan Consumer Survey. To put this into perspective, median inflation expectations had been at ~3% from the late 1990s to 2020 until COVID hit. Consumer sentiment has been severely damaged by rising prices of necessities such as food, energy, transportation, education and healthcare.
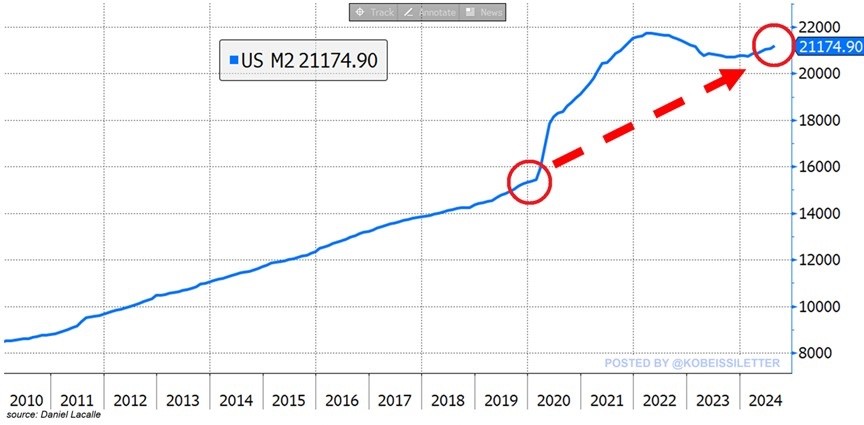
Underscoring this sharply rising trend, the US M2 money supply hit $21.2 trillion in August, the highest level since January 2023 and a fifth consecutive monthly increase for M2. Over the last 10 months, the amount of US Dollars in circulation jumped by nearly half a trillion. In effect, the money supply is now just $548 billion below a new all-time high. After a brief decline in 2022 due to rate hikes, the quantity of money in the financial system is surging again raising concerns about another wave of inflation. QE is alive and well as total debt in the US now exceeds $35 trillion. For perspective, back in December 2023, total federal debt was $33.1 trillion; $26.5 trillion held by the public and $12.1 trillion in intragovernmental debt. The annualized cost of servicing this debt was $726 billion in July 2023, which accounted for 14% of the total federal spending.
Gold
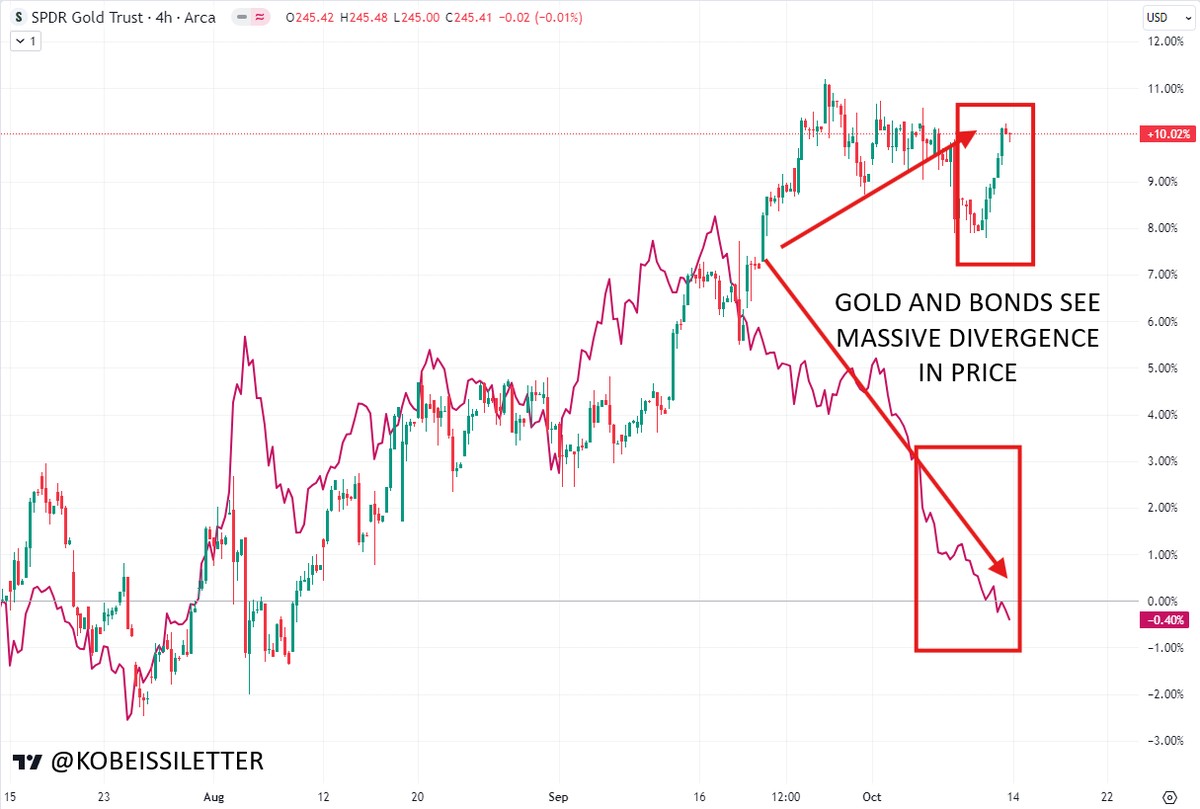
Gold markets may be telling us something. Over the last 3 weeks, bond prices crashed and the US Dollar surged implying the Fed will not be able to cut rate as quickly. Normally, this would be bearish for gold. Yet gold has been on a sharp uptrend. Historically speaking, bond prices and gold have a rough correlation because in times of uncertainty, investors flock to gold and bonds as safe havens. But as of late, gold and bonds have been moving in opposite directions. Investors are selling bonds even after the Fed cut by 50 bps due to signs of stubborn inflation which are pushing the 3-mo bond higher while CME FedWatch is predicting just one rate cut at each of the Fed's next two meetings.
Since 2023, gold has been on a sharp uptrend. Gold is often viewed as the best hedge against inflation. This is why gold prices can lead a surge in CPI inflation, which usually lags reality because the CPI is highly manipulated to give the illusion of lower inflation. On top of this, gold markets are weighing a potential hard landing spurred by major geopolitical tensions around the globe. When comparing gold's exponential rise this year to 1979 when gold broke $800, the charts look somewhat similar so far. Back then, inflation rebounded from the mid-1970s bottom into the 1980s inflation crisis where Fed Chair Paul Volcker had to break the back of inflation by hiking interest rates to double digit record levels.
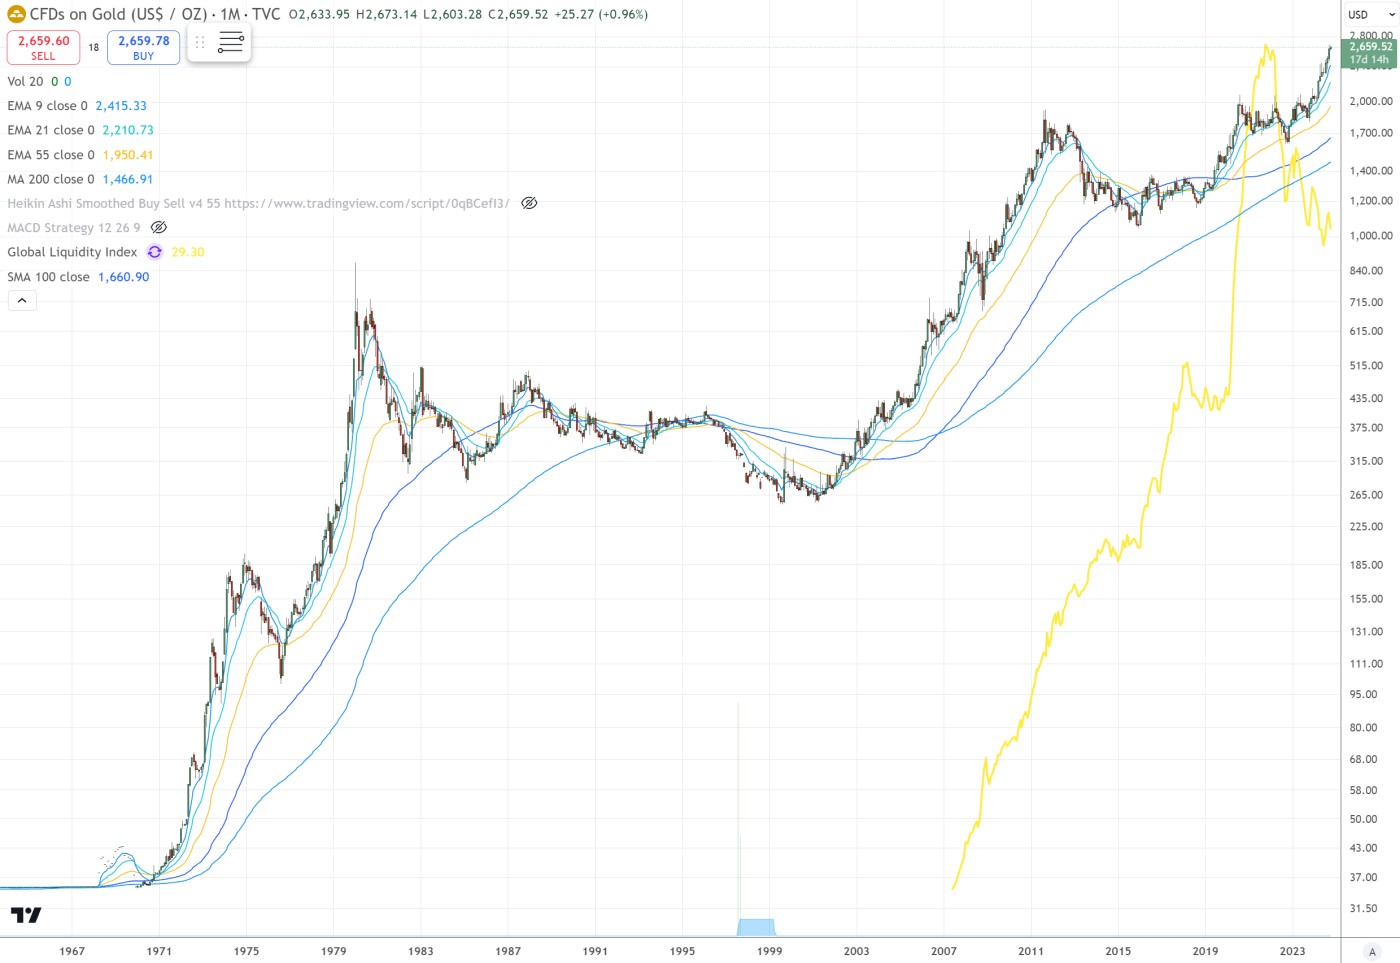
Today, central banks around the world are stocking up on gold while calling for an alleged "soft landing." Official world gold reserves are their highest levels since the 1970s.
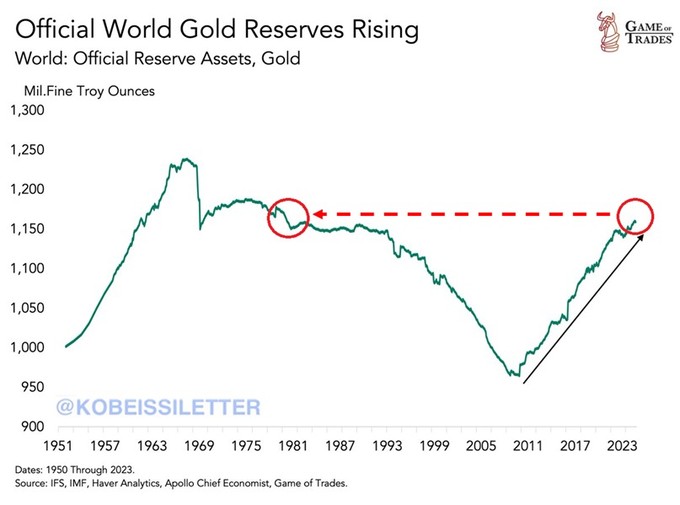
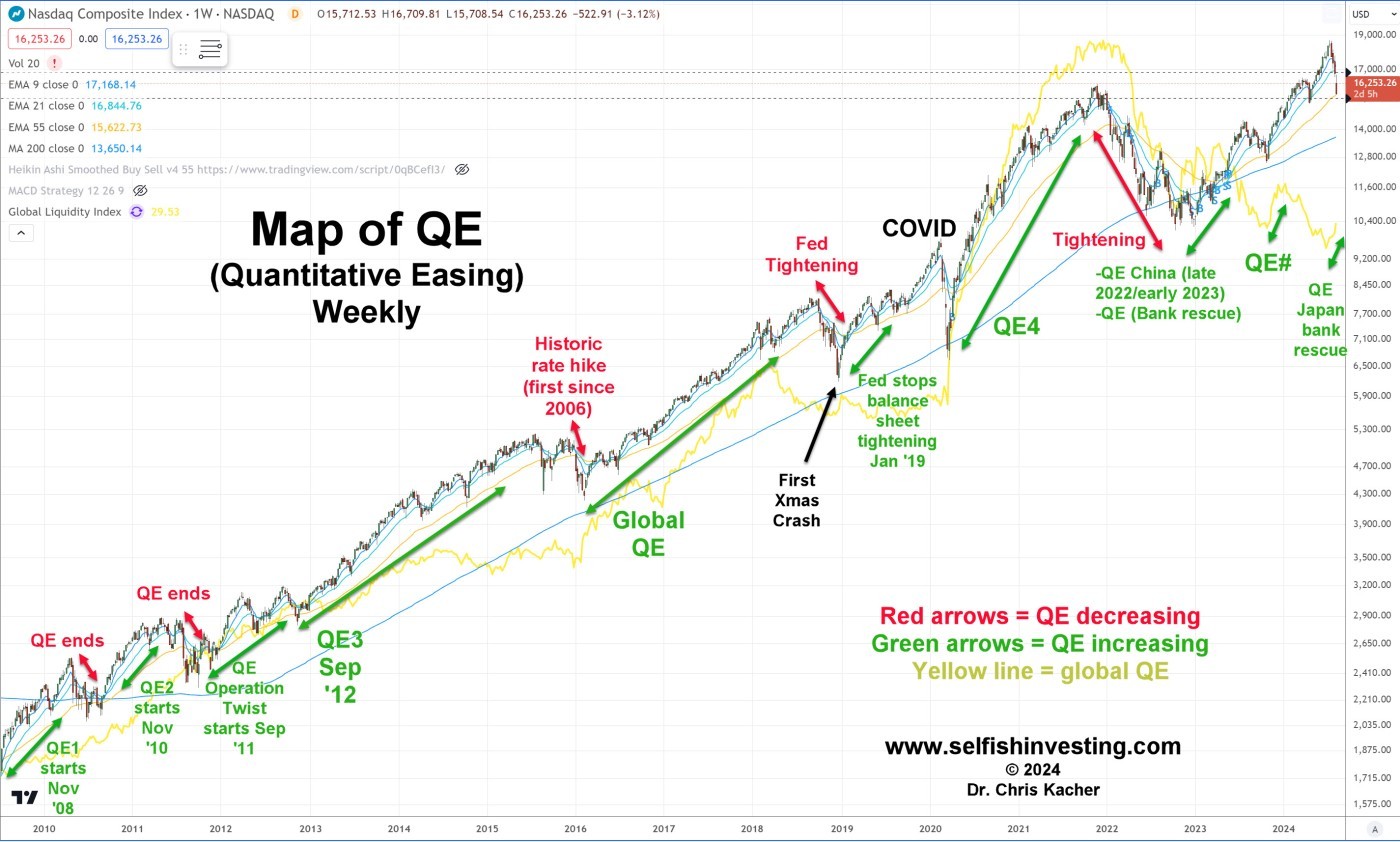
Indeed, the wave of global liquidity may spur another wave of inflation though it often takes time for inflation in the official data to materialize. It was not until 2022 that the tsunamic levels of QE during COVID in 2020 and 2021 triggered inflation. That said, a few countries that have had traditionally low rates of inflation are seeing inflation pick up once again. But the CPI, PPI, and PCE have been manipulated over the years, so they can be manipulated again. For example, in the CPI, health insurance is down -33% in the last 2 years. Obviously this ludicrous because the BLS continues to use retained earnings instead of actual premiums which were up 7% in 2023. In the next 12-24 months, a new inflationary norm of at least 3% seems to be in the offing but somehow as always, the Fed will find a way to justify the new norm and as long as liquidity does not slow, markets should, by and large, continue trending higher as shown in this infamous chart of mine (up thru July):
UK and EU on target
Meanwhile, inflation in the UK fell to below the Bank of England's target, setting up a rate cut when they meet next month. Consumer prices were 1.7% higher in September than the same month of last year, easing from the 2.2% rate of inflation in August, and well below the expected 1.9%. British inflation’s downward trajectory, combined with slowing wage growth, emphasises Bank of England's latest comments that the bank will get ‘more aggressive’ on its rate policy.
This was the first time it fell below the 2% mark since April 2021. Markets now predict there’s a better than 80% chance the UK will end the year with rates down to 4.5% from 5% currently.
Over in the Eurozone, inflation fell to 1.8% in September, below its 2% target for first time in three years. The last time inflation hit the ECB's 2% goal was in June 2021 when it was 1.9%.